Climate Proxies
Climate Proxies. How can you measure the climate of the past?. Learner outcomes. At the end of this lecture you should be able to Describe how proxies differ from observations Describe how tree rings, corals, fossils, lake ice and lake duration are used to estimate local climate

Climate Proxies
E N D
Presentation Transcript
Climate Proxies How can you measure the climate of the past?
Learner outcomes At the end of this lecture you should be able to • Describe how proxies differ from observations • Describe how tree rings, corals, fossils, lake ice and lake duration are used to estimate local climate • Describe how ocean sediment and ice cores are used to estimate global climate • The difference between stable and radiometric isotopes and what type of information they tell use about past climates
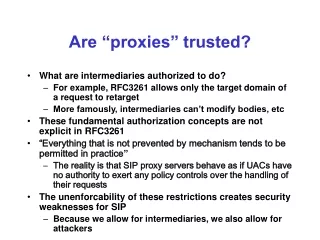
Proxies Unlike instrumental records that tell us only about the most recent century, proxy records (natural archives of climate change) enable us to place recent climatic change in the context of the last several hundred to thousand years.
CO2 Concentrations Temperature (Northern Hemisphere) 1000 Years of CO2 and Global Warming
How do we develop proxies? • Assumptions • Observations of phenomenon today • Link current observations to past records
Assumptions • Observation: Solar radiation varies but overall decreases • Therefore solar radiation in the past was higher
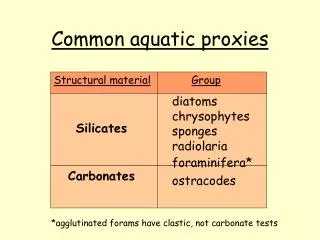
Proxies • Corals* • Tree rings* • Pollen* • Fossils* • Sea level • Lake ice duration* • Ocean sediments • Ice Cores *indicative more of local climate change than global climate change
Corals • Shells made of Calcium Carbonate (CaCO3) • Shell in equilibrium with the ocean water • Band width provided evidence of temperature the coral grew in • Growth rates change with ocean temperatures, pHlevels • Local climate
Why should we hug trees? • Dendrochronology is the study of the annual variability of tree ring widths, which can be extended back to 8000 years ago. • The study of trees provides climate information regarding temperature, runoff, precipitation, and soil moisture. • Local climate Date of last ring is year tree was cut 1930 1950 1970 1890 1910 1870
Tree Rings Growth conditions recorded in rings • Wide ring-warm days sufficient water • Narrow-cold days/drought
What can plant and animal fossils tell us about ancient climates? These 350 Ma fossil ferns were most likely the oldest on land, and likely required high pCO2 levels. • Certain plants and animals live only in specific environments, so their presence is a clue to local climate. A trilobite, the three- lobed king of warm, shallow Cambrian seas Soft-bodied Waptia, an arthropod from the Cambrian Burgess Shale
Examples of Climate Proxies • Pollen Lake Ice Duration • Tree Rings Lake Ice Thickness • Ice Cores
Global Proxies • Sea level • Ocean sediment • Ice cores • Layers (varves) in ice cores • Gases in ice cores • Stable Isotopes: O-16 to O-18 ratio in ice cores • Radiometric Isotopes:Carbon dating of sediment in the ice cores or glacial deposits
Sea Level • Glaciation –low sea level
Thick levels of sedimentation can indicate heavy weathering, warmer temperatures Volcanic sediments Loss of sediment layers through erosion 55 mya Ocean Sediment Cores: 3-3.5km
Frozen Core Some cores go 3 km deep!
Vostok, Antarctica 78°28' S, 106°48'E: Coldest Places on Earth
Ice Cores: Varves • A varve is an annual layer of sediment or sedimentary rock
Section of Greenland Cores Dozen Ice Ages going back 1 billion years
How can ancient greenhouse gases be trapped? • Atmospheric gases (CO2, CH4, SO2, etc.) can be trapped in glaciers as frozen water metamorphoses from snow to firn to recrystallized ice. During the Last Glacial Maximum pCO2 is estimated at 180 ppm The record of atmosphere CO2 since the Industrial Revolution
Isotopes • Stable Isotopes-temperature • Radiometric dating-rate and date
How can oxygen isotopes used as paleoclimate proxies? • isotope -- atoms of the same element with the same atomic number (chemical properties) but differing atomic weight (physical properties). Differ in number of neutrons. • Oxygen is composed mostly of 16O and 18O, which as part of water molecules are separated by physical processes. A typical carbon atom with 6 protons and 6 neutrons and 6 electrons.
Fractionation • To divide or separate into parts • Ocean water is made up of both O-16 and O-18 There is a standard or average ratio of O-18 to O-16 (standard mean ocean water as the baseline, SMOW) • Certain physical and biological processes change the ratio (this is fractionation)
Oxygen Isotopic Ratios or Amounts O18/O16 ratio in glacial ice indicate the atmosphere temperature in which the snow that made up the ice formed Extent of isotopic difference (fractionation) is dependent on the temperature. So they form a temperature proxy!
Oxygen Isotopic Ratios vs. Amounts O18/O16 ratio versus O-18 and O-16 Usually described as a ratio
Oxygen Fractionation Summary • If ratio O-18 to O-16 is higher than expected in the ocean, colder temperatures • If ratio O-18 to O-16 is lower than expected in the ocean, warmer temperatures
Oxygen Isotopes in Glacier Ice • Polar ice is preferentially enriched with O-16 relative to the ocean (O-16 locked in glacier ice). So especially during glaciation ocean water is “heavy” • Why is glacier ice “light”? • The water source is from precipitation which is preferentially light. • So during a glaciation you would expect remaining ocean water to be heavy
Radiometric Isotopes • Isotopes that decay (Carbon) can tell us the approximate date of an event or the rate at which an event took place • Glacial retreat