
Introduction
Using VIRIS Scans to Detect Early Presence of Lecanosticta acicola in First Year Pinus Strobus Needles Stephen Wyka. Figure 6: Spring time (May-July) average precipitation (inches) in Fox Forest, grey and MEF, black. .

Introduction
E N D
Presentation Transcript
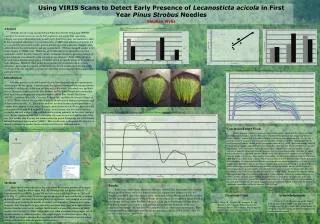
Using VIRIS Scans to Detect Early Presence of Lecanostictaacicola in First Year PinusStrobusNeedles Stephen Wyka Figure 6: Spring time (May-July) average precipitation (inches) in Fox Forest, grey and MEF, black. Figure 5: Linear regression of previous years spring time (May-July) average precipitation (inches) versus current years defoliation severity. Abstract Methods for surveying and identifying White Pine Needle Defoliation (WPND) caused by Lecanostictaacicola can be both expensive and overly time consuming. Cheaper and quicker diagnostic tools would benefit both researchers and landowners alike. In this experiment reflectance curves produced by a VIRIS were utilized to determine if L. acicola could be detected in needles prior to disease signs and symptoms. Samples were collected from two infected forest and one control forest. Obvious damaged needles were removed prior to VIRIS scans. While one of the infected forests showed no variation against the control, the other showed evidence of damage and stress, presence and lack of peaks within the near-infrared region, not seen at any other site. Peaks within the near-infrared region demonstrate presence of tannins, which are usually produced by needles to fight infections. However, these peaks do not prove to be associated with L. acicola infections.Increasing the number of infected forests tested would help determine if this evidence of damage and stress is associated with other forests showing defoliation or this particular forest. Figure 2: Healthy versus diseased tagged trees at Fox Forest, grey and MEF, black. Figure 3: Cleaned up samples prior to scanning; Fox Forest (A), College Woods (B), and MEF (C). Figure 7: Close up of near-infrared on all Fox Forests samples and replicates. A B C Introduction Over the past four years white pines all over New England have been prematurely defoliating in the late spring. Concern grows throughout landowners and managed forests over what is causing this defoliation and how will it affect their individual trees and their forests. Research conducted by Dr. Kirk Broders and Dr. Isabel Munck have shown that three main foliar pathogens are associated with the White Pine Needle Defoliation (WPND): Lecanostictaacicola, Canavirgellabanfieldii, and Bifusellalinearis(Muncket al. 2012). Their research also provided a map for distribution of damage reported for each of these pathogens (Fig. 1). The current methods for identification if pathogen requires samples to be shipped, frozen, re-moisturized, cultured from which DNA is then extracted and sequenced through PCR of the ITS region. Aerial surveys are also utilized but are expensive and lack accuracy, due to defoliation occurring primarily on the lower crown of trees. In this experiment I attempt to determine if Lecanostictaacicola can be detected in first year needles after a spring and summer infection period through the use of the Visible Infrared Intelligent Spectrometer (VIRIS). This would create a cheap and effective way to identify pathogens in needles which can then be utilized for further research. Figure 4: Average reflectance curves of Fox Forest (solid black), College Woods (darker grey dashed lines), and MEF (grey dots). Conclusion/Future Work We can presume, with pretty good accuracy, that the needles taken from Fox Forest and MEF have been infected with L. acicola. This can be concluded from previous data suggesting that even known “healthy” trees from Fox Forest and MEF are starting to show symptoms of L. acicola (Fig. 2). Even though these measurements were taken based upon second year needles, rainfall data could be used to suggest if and the amount of first year needles infected (Fig. 5&6). Also from samples taken all College Woods samples contained three years of needles while both Fox Forest and MEF had only first year needles (~90% of samples) with some having small amounts of second year needles. Larger amounts of rainfall lead to more sever defoliation events in diseased and healthy trees (Fig. 5), which tells us the disease is spreading and thus samples from random trees are a supportive enough to test since the height of trees was a large problem in sampling. The first peaks shown in both Fox Forest and MEF (Fig. 4) are known to be a tannin. While the second peak in Fox Forest is unknown, but thought to also be a tannin. It can be concluded that the second peak is not an artifact because it was seen in all the samples from Fox Forest (Fig. 7). Fox Forest samples also show a complete lack of the third NIR peak, which would suggest statistical differences between that and the control, but the ANOVA analysis proved insignificant (p-value >0.05). It is concluded that L. acicola cannot be prematurely detected in infected first year Pinusstrobus needles through the use of the VIRIS. We determined that the strange NIR peak of Fox Forest is real but is unidentified. Further research needs to be conducted to progress further. Another sampling can be redone at Fox Forest to see if the peaks are repeatable at the same forest. If so more forests around New England infected with L. acicola should be tested to conclude if the same peaks are present. Research in specific tannins should be utilized to determine the identity of a particular tannin that is reflective between 1050-1060 nm. Figure 1: Distribution map of three foliar pathogens, L. acicola, C. banfieldii, and B. linearis over New England (Muncket al. 2012) Methods Three forests were selected for this experiment based upon presence of pathogen and distance. Both Fox Forest State Park, Hillsborough NH and the Massabesic Experimental Forest (MEF), Lyman ME have recorded defoliation events in 2012 and 2013 (Fig. 2), while College Woods has never had reports of early defoliation, according to Isabel Munck. Six trees with two replicates (if applicable) were sampled at each site at a height of 40 ft during the months of October and November. Samples were taken from trees that were known to have infections, and from trees close by to infected trees if lower branches could not be reached. Each branch was noted for presence of yearly needles and stored at 5°C. First year needles were taken at random from samples and all obvious necrotic or chlorotic needles were removed prior to reflectance curves (Fig. 3). The VIRIS was used to obtain reflectance curves, ProVIRIS determined spectral indices, and excel to create graphs and produce statistical data. Results Reflectance curves shows almost no difference between first year needles from College Woods and Fox Forest, while Fox Forest needles has slightly lower reflectance (Fig. 4). Samples from MEF shows the cleanest curve, while both College Woods and Fox Forest show obvious spectral significances. College Woods shows a dip in the second near-infrared peak at wavelength 1050 nm, while Fox Forest shows a similar dip at wavelength 1060 nm (Fig. 4). Fox Forest samples also contain a peak between the second and third peaks of the near-infrared at wavelength 1180 nm and also a complete lack of a third near-infrared peak. There were no significant differences between the spectral indices; REIP, NDVI, TM 4/5, NIR 3/1 for any of the sites (p-value >0.05). Literature Cited Munck, I., Burns, B., Ostrosky, W., Lombard, K., and Weimer, J. 2012. Eastern White Pine Needle Damamge Survey, 2011in Maine, New Hampshire, and Vermont. Forest Service U.S.D.A. • Acknowledgements • Thanks to Dr. Martha Carlson and Dr. Barry Rock for their help in VIRIS scans and analysis of reflectance curves. Also thanks to Dr. Isabel Munck for setting up research locations around New England to be used for further research.


