Download
1 / 1
10 likes | 127 Vues
Figure 4. Mixed layer physical processes Positive values are sources to mixed layer. Air-sea exchange dominates over other transport processes. Large negative values due to gas exchange in summer result from supersaturation and a shallow mixed layer.

E N D
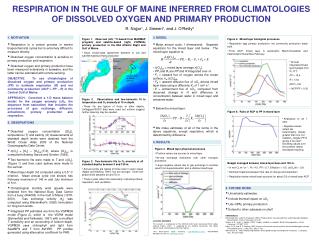
Figure 4. Mixed layer physical processes • Positive values are sources to mixed layer. • Air-sea exchange dominates over other transport processes. • Large negative values due to gas exchange in summer result from supersaturation and a shallow mixed layer • Figure 3. Two-harmonic fits to O2 anomaly at all standard depths between 0 and 150 m. • Annual cycles are typical of those seen in open ocean (Najjar and Keeling, 1997), but are stronger. Note how phase shifts between 20 and 75 m. • These cycles reflect the seasonality of photosynthesis, respiration, and ventilation. RESPIRATION IN THE GULF OF MAINE INFERRED FROM CLIMATOLOGIES OF DISSOLVED OXYGEN AND PRIMARY PRODUCTION R. Najjar1, J. Siewert1, and J. O’Reilly2 1. MOTIVATION 3. MODEL • Figure 1. Observed (left, 14C-based from MARMAP program) and satellite-based (right, VGPM2A) primary production in the Mid Atlantic Bight and Gulf of Maine. • Good, broad-scale agreement between in situ and satellite-based primary production • Figure 5. Mixed layer biological processes • Respiration lags primary production; net community production leads both. • From NCP, mixed layer is autotrophic March-November and heterotrophic December-February. • Respiration is a central process in marine biogeochemical cycles but is extremely difficult to measure directly. • Dissolved oxygen concentration is sensitive to primary production and respiration. • Dissolved oxygen and primary production have been measured extensively in seawater, and the latter can be estimated with remote sensing. OBJECTIVE: To use climatologies of dissolved oxygen and primary production (PP) to estimate respiration (R) and net community production (NCP = PP – R) in the Central Gulf of Maine. APPROACH: Construct a 1-D mass balance model for the oxygen anomaly (DO2, the departure from saturation) that includes the processes of gas exchange, diffusion, entrainment, primary production and respiration. • Mean annual cycle, 1-dimensional. Separate equations for the mixed layer and below. The mixed layer equation is: • Annual, integrated mixed layer budget (mol O2 m-2): • PP = 19.4 • R = 13.6 • NCP = 5.8 • NCP/PP = 0.30 • D[O2]ml = mixed layer average D[O2]. • PPI and RI are PP and R integrated over H. • Fs = upward flux of oxygen across the ocean surface, kw D[O2]sfc. • FB = upward diffusive flux of DO2 across mixed layer base using a diffusivity Kz of 1 cm2 s-1. • E = entrainment flux of DO2, computed from observed change in H and difference in concentration between water in mixed layer and entrained water. Central Gulf of Maine subarea Figure 2. Observations and two-harmonic fit to temperature and O2 anomaly at 10 m depth. • These fits are typical of those at other depths. Unflagged NODC data were used, but outliers suggest further cleaning may be needed. • Below the mixed layer: Figure 6. Ratio of NCP to PP in mixed layer • Analogous to an f-ratio. • Negative values reflect net heterotrophy. Values greater than one not realistic—maybe PP in spring is too low? Declining values over the summer reflect increased recycling. 2. OBSERVATIONS • We make estimates of all of the terms in the above equations, except respiration, which is determined by difference. • Dissolved oxygen concentration ([O2]), temperature (T) and salinity (S) measurements at standard depth levels were obtained from the World Ocean Atlas 2005 of the National Oceanographic Data Center. • D[O2] = [O2] – [O2]sat(T,S), where [O2]sat is computed following Garcia and Gordon (1992). • Two-harmonic fits were made to T and D[O2], (Figure 1) and then cubic splines were made in the vertical. • Mixed layer depth (H) computed using a 0.5° C criterion. Mean annual cycle (not shown) has February maximum of 146 m and July minimum of 6 m. • Climatological monthly wind speeds were obtained from the National Buoy Data Center from a buoy (#44005) in the Gulf of Maine (1978-2001). Gas exchange velocity (kw) was computed using Wanninkhof’s (1992) formulation for long-term winds. • Integrated PP estimates are from the VGPM2A model (Figure 2), which is the VGPM model (Behrenfeld and Falkowski, 1997) with a modified T sensitivity and an accounting of bottom depth. VGPM2A uses chlorophyll and light from SeaWiFS and T from AVHRR. PP profiles generated using attenuation coefficient for PAR. 4. RESULTS • Budget averaged between mixed layer base and 150 m. • In mol O2 m-2 yr-1: R = 4.0, PP = 0.7, Diffusion = -0.5, dDO2/dt = -2.8. • Dominant balance between time rate of change and respiration • Respiration below mixed layer accounts for about 2/3 of mixed layer NCP 5. FUTURE WORK • Uncertainty estimates • Include thermal impact on DO2 • Use OPAL primary production • Extend to other subareas on shelf REFERENCES Behrenfeld, M.J. and P.G. Falkowski (1997), Photosynthetic rates derived from satellite-based chlorophyll concentration. Limnol. Oceanogr., 42:1-20. Garcia, H. E., and L. I. Gordon (1992), Oxygen solubility in seawater: Better fitting equations, Limnol. Oceanogr., 37:1307-1312. Najjar, R. G., and R. F. Keeling (1997), Analysis of the mean annual cycle of the dissolved oxygen anomaly in the World Ocean, J. Mar. Res., 55:117-151. Wanninkhof, R., 1992, Relationship between wind speed and gas exchange over the ocean. J. Geophys. Res., 97:7373-7382. ACKNOWLEDGMENTS This research is a component of The USECoS (US Eastern Continental Shelf Carbon Cycling) Project, which is supported by the National Aeronautics and Space Administration Interdisciplinary Science Program. 1The Pennsylvania State University najjar@meteo.psu.edu; 2NOAA/NMFS Narragansett Lab Jay.O’Reilly@noaa.gov