Enhancing Fund Activity Reports with Excel | Learn Advanced Excel Features for Data Analysis
This guide covers exporting and manipulating fund activity reports in Excel. Learn how to utilize advanced features like AutoFilter, Pivot Tables, and SUBTOTAL function for efficient data analysis and presentation. Enhance your Excel skills now!

Enhancing Fund Activity Reports with Excel | Learn Advanced Excel Features for Data Analysis
E N D
Presentation Transcript
Fund Activity Reports They’re not just for binders anymore! John Sterbenz Kresge Business Administration Library The University of Michigan Eastern Great Lakes IUG 2008 Meeting The Conference Center at OCLC Dublin, Ohio Friday, September 19, 2008
INNOPAC history • INNOPAC site since 1992 (Release 6) • Acquisitions implemented July 1994 • MilAcq implemented January 2003 • Traditional acquisitions • FY statistics • Release 2006 integrated beta test site • Full Release installed August 1, 2006
About the Library • Technical Services staffing • Selection librarians • Microsoft Office familiarity • Financial structure • Account reconciliation
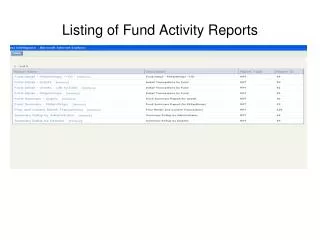
Exporting fund activity (#105490) • New in Release 2006! For all funds: • Change current mode to “Funds” • Select “Current Funds” subfolder • Select “Activity” tab • Click “Export” • Choose “Open in Excel”
Things to note about exporting • Availability of exporting option • Differences from printing process • Selection of “Show all” • Display of “Activity Summary” box • Clearing the payment history file
Printing/Exporting differences Print version only • Previous balance information • Current balance information • Report-specific statistics • YTD statistics Exported version only • Date information
Lists in Excel • Terminology • Header • Fields • Records • Well-formatted list characteristics
Features in Excel • Sort • Find • AutoFilter • Advanced Filter • Pivot Tables • Presentation prepared with Excel 2003; your mileage may vary!
Features in Excel: Sort • Default sort of exported data • From the Data menu, select Sort • Sort by up to three fields in the order specified, ascending or descending • See sort currently in place by going to DataSort
Features in Excel: Find • Specify multiple criteria, one per field • Boolean operator AND joins fields • Use comparison operators • Good for quick and dirty searches
Features in Excel: Find (cont.) • From the Data menu, select Form • Click “Criteria” • Enter criteria • Use “Find Prev” and “Find Next” to scroll among matching records
Features in Excel: Find (cont.) • Cons to Find • No provided number of matches • Only one criterion per field • No support for Boolean OR • AutoFilter to the rescue!
Features in Excel: AutoFilter • Specify up to two criteria per field • Boolean AND used to join criteria in separate fields • Boolean AND and OR available to join criteria in the same field • “Top” and “Bottom” filtering options available
Features in Excel: AutoFilter (cont.) • From the Data menu, select Filter, then AutoFilter • Select fields and criteria using drop-down options in header row • Remove filter with DataFilterShow All • Records not meeting filter criteria are hidden from view, never deleted
Features in Excel: AutoFilter (cont.) • EXAMPLE 1: Find all expenditures between $1,000 and $5,000 • Exp: (Custom) is greater than 1000 AND is less than 5000
Features in Excel: AutoFilter (cont.) • EXAMPLE 2: Find all expenditures between $1,000 and $5,000 from Electronic Database fund (edb) • Exp: (Custom) is greater than 1000 AND is less than 5000 • Fund Code:edb
Features in Excel: AutoFilter (cont.) • EXAMPLE 3: Give me the top 1% of expenditures across all funds • Exp: (Top 10…) Top 1 Percent • Apply descending sort from within filter • Excel 2003 feature • What do these expenditures total?
Features in Excel: SUBTOTAL • SUBTOTAL function acts only on records displaying through the filter • Two arguments • Function call • “9” for SUM • Range of cells to include • As filter (and displayed records) changes, SUBTOTAL value changes
Features in Excel: AutoFilter (cont.) • EXAMPLE 3 (cont.): What do the top 1% of expenditures total? • In cell I2620: =SUBTOTAL(9,I2:I2618)
Features in Excel: AutoFilter (cont.) • Cons to AutoFilter • No support for Boolean OR to join fields • Maximum two criteria per field • Advanced Filter saves the day!
Features in Excel: Advanced Filter • Specify two or more fields, joined by Boolean OR • Specify three or more criteria for any given field • Allows extracting of filtered records into another part of the current worksheet • Invoke using DataFilterAdvanced Filter
Features in Excel: Adv. Filter (cont.) • How does it work? • Specify fields by labels in header row • Case insensitive • Place criteria in same columns as labels • Include both comparison operator and criterion in cell • Criteria in same row ANDed together • Criteria in different rows ORed together
Features in Excel: Adv. Filter (cont.) • EXAMPLE: Find all expenditures from both Electronic Databases and all “/o” funds between $1,000 and $5,000 • Insert blank rows • Enter criteria for search • Column B C D • Row 1: Fund Code Exp exp • Row 2: edb >1000 <5000 • Row 3: */o >1000 <5000
Features in Excel: Adv. Filter (cont.) • EXAMPLE (cont.): • DataFilterAdvanced Filter • Select “Filter the list, in place” • List range: $A$6:$K$2623 • Criteria range: $1:$3
More on SUBTOTAL • Additional supported functions • “1” for AVERAGE, “2” for COUNT, “3” for MAX, “4” for MIN • In cell I2625: =SUBTOTAL(9,I7:I2623) • In cell I2626: =SUBTOTAL(2,I7:I2623) • Note formatting • In cell I2627: =SUBTOTAL(1,I7:I2623)
Features in Excel: Pivot Tables • What is a Pivot Table? • Pivot Table features • Interactivity • Data rearrangement • Automatic subtotals • No formulas involved! • Invoke Wizard via DataPivot Table and Pivot Chart Report
Features in Excel: Pivot Tables (cont.) Steps in the Pivot Report Wizard • Step 1: Select data source and type of Pivot Report desired • Step 2: Select data range • Step 3: Select Pivot Report location and configure options • Drag and drop fields from the Pivot Table Field List to the Pivot Table.
Features in Excel: Pivot Tables (cont.) • What goes where: Pivot Table basics • Fields to summarize by go in Row and Column areas • Fund Code or Fund Name, Date, Report Date • Fields to summarize go in Data area • Appro, Exp, Enc
Features in Excel: Pivot Tables (cont.) • EXAMPLE 1: What are the total expenditures for each fund, YTD? • Fund Code to Row Fields • Exp to Data Items • Not what we expected! Why? • Right-click to select Field Settings • “Count” to “Sum”; number formatting
Features in Excel: Pivot Tables (cont.) • EXAMPLE 2: What are the total expenditures for each fund, YTD, broken down by reporting month? • Report Date to cell B3
Features in Excel: Pivot Tables (cont.) • EXAMPLE 3: Give me this breakdown just for marketing (mar) and finance (fin) funds • Click drop-down on Fund Code; select/clear checkboxes • EXAMPLE 4: Include appropriations for all funds in the report • Drag Appro to Data Items; correct data display and number formatting
Features in Excel: Pivot Tables (cont.) • EXAMPLE 5: Add encumbrances to our report (just like a detailed financial report) and remove the breakdown by report date • Right-click, invoke Wizard, click Layout, add Enc to Data Items and correct display, remove Report Date • Is this the same as a DFR? Almost—but not quite
Features in Excel: Pivot Tables (cont.) • Horizontal vs. vertical display • Drag Data onto Total cell (C3) for horizontal display • Drag Data onto down arrow of Fund Code to revert back to vertical display
Features in Excel: Pivot Tables (cont.) • Add rolled-over encumbrances to exported fields • Fund Code • Fund Name • Type (Enc) • Title (Encumbrance Carryover) • Enc (Based on FY 2007 opening DFR) • Report Date (6/2006)
Features in Excel: Pivot Tables (cont.) • Calculating Free Balance, Cash Balance, and Percent Expended (%) • Free Balance: In E5, TYPE =B5-C5-D5 • Cash Balance: In F5, TYPE =B5-C5 • % Expended: In G5, TYPE =1-(E5/B5) • Drag each calculation down for all funds • To correct #DIV/0! Error, use the following: • =IF(B5<>0,1-(E5/B5),”**”)
Other Pivot Table comments • All data, even hidden rows, are used • Use Advanced Filter to create a new list from which to base your Pivot Table • Experiment with field placement • A Pivot Table is only a data summary tool; you can’t harm underlying data by manipulating Pivot Table views
Other things to consider • Keep two separate files: a master file, and a working file for staff • Consider making “read-only” • Restrict access to master file • Identify small number of staff to maintain master file • Keep each export in its own file
References CustomGuide, Inc. Excel 2003 Personal Trainer. 1st ed. Sebastopol: O’Reilly, 2004. Dalgleish, Debra. Excel Pivot Tables Recipe Book.Berkeley: Apress, 2006. Frye, Curtis. Microsoft Office Excel 2003 Step by Step. Redmond: Microsoft, 2004. Stinson, Craig, and Mark Dodge. Microsoft Office Excel 2003 Inside Out. Redmond: Microsoft, 2004.
But wait—there’s more! We’re just getting started! Come see Part 2: Beyond Our Binders: More fun with exported fund activity data
Thank you! John Sterbenz (jsterben@bus.umich.edu) Manager, Technical Services and Library Automation Kresge Business Administration Library Ross School of Business The University of Michigan