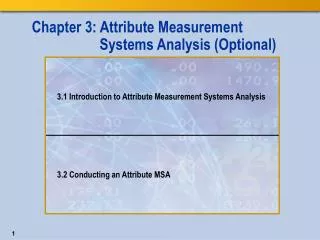
Chapter 3: Attribute Measurement Systems Analysis (Optional)
Chapter 3: Attribute Measurement Systems Analysis (Optional). Chapter 3: Attribute Measurement Systems Analysis (Optional). Objectives. Introduce the basic concepts of an attribute measurement systems analysis (MSA). Understand operational definitions for inspection and evaluation.

Chapter 3: Attribute Measurement Systems Analysis (Optional)
E N D
Presentation Transcript
Chapter 3: Attribute Measurement Systems Analysis (Optional)
Chapter 3: Attribute Measurement Systems Analysis (Optional)
Objectives • Introduce the basic concepts of an attribute measurement systems analysis (MSA). • Understand operational definitions for inspection and evaluation. • Define attribute MSA terms.
What Is an MSA? • A measurement systems analysis is an evaluation of the efficacy of a measurement system. • It is applicable to both continuous and attribute data. • An attribute MSA evaluates whether a classification system correctly sorts items. • Companies make decisions each day based on classifications; it is necessary to evaluate the efficacy of such classifications.
Operational Definitions • In order for a rater to decide if a product is defective or not, he must have a clear description, or an operationaldefinition, of what constitutes a defect. Such a definition might include the following: • photographs • physical specimens • descriptions • specifications.
Effectiveness • The effectiveness of an inspection process • is the percentage of time that a rater, or other measurement tool, is correct in its classification of quality • is often significantly low before any attempts at improvement are instigated • should be at least 95%. • Effectiveness = number of correct evaluations • number of total opportunities
3.01 Multiple Choice Poll • Suppose 100 windshields are inspected, and 10 are defective and 90 are non-defective. If an inspector decides that 6 non-defectives are defective, and 1 defective is non-defective, what is his effectiveness? • .67 • .067 • .1 • .93 • None of the above
3.01 Multiple Choice Poll – Correct Answer • Suppose 100 windshields are inspected, and 10 are defective and 90 are non-defective. If an inspector decides that 6 non-defectives are defective, and 1 defective is non-defective, what is his effectiveness? • .67 • .067 • .1 • .93 • None of the above
False Alarms • A false alarm is a non-defective item that is classified as defective. • The probability of a false alarm, also known as Type I error or producer’s risk, is given by: • P(False Alarm) = number of false alarms • number of non-defective items
3.02 Multiple Choice Poll • Suppose 100 windshields are inspected, and 10 are defective and 90 are non-defective. If an inspector decides that 6 non-defectives are defective, and 1 defective is non-defective, what is the probability of a false alarm? • .67 • .067 • .1 • .93 • None of the above
3.02 Multiple Choice Poll – Correct Answer • Suppose 100 windshields are inspected, and 10 are defective and 90 are non-defective. If an inspector decides that 6 non-defectives are defective, and 1 defective is non-defective, what is the probability of a false alarm? • .67 • .067 • .1 • .93 • None of the above
Misses • A miss is a defective item that is classified as non-defective. • The probability of a miss, also known as Type II error or consumer’s risk, is given by: • P(Miss) = number of misses • number of defective items
3.03 Multiple Choice Poll • Suppose 100 windshields are inspected, and 10 are defective and 90 are non-defective. If an inspector decides that 6 non-defectives are defective, and 1 defective is non-defective, what is the probability of a miss? • .67 • .067 • .1 • .93 • None of the above
3.03 Multiple Choice Poll – Correct Answer • Suppose 100 windshields are inspected, and 10 are defective and 90 are non-defective. If an inspector decides that 6 non-defectives are defective, and 1 defective is non-defective, what is the probability of a miss? • .67 • .067 • .1 • .93 • None of the above
Escape Rate • An escape rate gives the percentage of time a customer is likely to see a defective item. • Escape Rate = P(Miss) × P(Defect) • where P(Defect) = number of defects • number of items inspected.
Bias • Bias is the tendency of an inspector to classify items either as defective or as non-defective. • Bias is defined as P(False Alarm)/P(Miss). • Bias =1 implies there is no bias. • Bias < 1 implies a bias towards accepting bad items. • Bias > 1 implies a bias towards rejecting good items.
3.04 Multiple Choice Poll • The bias is given by the probability of a false alarm divided by the probability of a miss. In the windshield example, the bias is given by .067/.1 = .67. What is the interpretation of this value? • There is no bias. • There is a bias towards accepting bad items. • There is a bias towards rejecting good items.
3.04 Multiple Choice Poll – Correct Answer • The bias is given by the probability of a false alarm divided by the probability of a miss. In the windshield example, the bias is given by .067/.1 = .67. What is the interpretation of this value? • There is no bias. • There is a bias towards accepting bad items. • There is a bias towards rejecting good items.
Rater Agreement • Rater agreement • is a measure of how well raters agree with each other • is not an indication of correctness
Kappa Statistic The Kappa statistic • is used to measure between-rater variability, or how often two or more raters agree in their interpretations • is a measure and not a test • is given by: • kappa = po – pe 1 – pe • where po is the sum of observed proportions in diagonal cells of the contingency table and pe is the sum of expected proportions in diagonal cells of the contingency table.
Chapter 3: Attribute Measurement Systems Analysis (Optional)
Objectives • Examine the requirements for an attribute MSA. • Perform an attribute MSA in JMP.
Sample Size • To conduct an attribute MSA, the minimum recommended sample sizes are given as follows:
Attribute MSA Example • Suppose three inspectors, Henry, Matt, and Tom, are independently going to classify each of 30 parts as defective or non-defective in a random order. They will evaluate each part three different times. Of the 30 parts, 13 are defective and 17 are non-defective. • The classification will be based on a predetermined operational definition of defective and non-defective.
Attribute MSA This demonstration illustrates the concepts discussed previously.
Exercise This exercise reinforces the concepts discussed previously.