Download
1 / 17
170 likes | 287 Vues
This overview explores the components of the federal budget, broken down into discretionary and non-discretionary spending categories. Discretionary spending accounts for approximately 37.5% of the budget, while non-discretionary spending, which includes mandatory programs like Social Security, constitutes about 57.1%. The analysis highlights historical trends in federal revenue, tax rates across income groups, and the implications of budget deficits and national debt. Understanding these dynamics is crucial for grasping the fiscal challenges faced by the government.

E N D
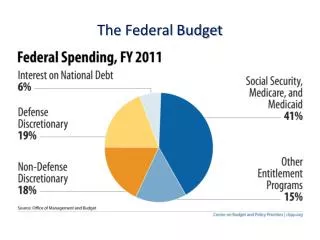
The Federal Budget Spending • Discretionary • Non-Discretionary Revenue
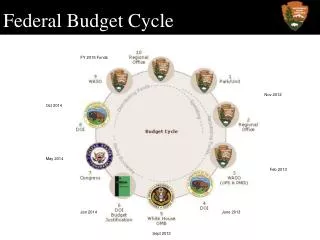
2012 Budget • White House, OMB 2013 Budget Page • FY 2012 Budget
Deficit and Debt Deficit or Surplus: Yearly account balance between spending and revenue
An Analysis of the President’s Budgetary Proposals for Fiscal Year 2011: http://www.cbo.gov/ftpdocs/112xx/doc11280/03-24-apb.pdf
National Debt National Debt: the accumulated deficits, plus other incurred debt National Debt Clock http://www.usdebtclock.org/
Who owns the Debt 2011?Federal Reserve information • US Federal Reserve and other Government Financial Entities • Other Investors/Savings Bonds • China • Japan • Pension Funds • Money Market Funds/Mutual Funds • State and Local Governments in US • UK • Banks • Insurance Companies • OPEC nations • Brazil • Caribbean nations • Hong Kong • Canada
Federal Debt as % of GDP 1962-2072from CBO, Director’s Blog “The Long-Term Budget Outlook” http://cboblog.cbo.gov/?p=328
Discretionary v. Non-Discretionary Spending Discretionary: 37.5% Non-Discretionary: 57.1% Interest: 5.2% From Pew Research Center http://pewresearch.org/pubs/1770/ask-the-expert-pew-research-center
Douglas W. Elmendorf, “The Budget and Economic Outlook,” February 25, 2010,http://www.cbo.gov/ftpdocs/112xx/doc11276/Final_CBO_Presentation_to_NEC_2.25.10.pdf
Social Security as a % of GDPfrom CBO, Director’s Blog “The Long-Term Budget Outlook” http://cboblog.cbo.gov/?p=328
From US Government Accountability Officehttp://www.gao.gov/cghome/townhall092905/img18.html
Federal Spending as % of GDP1950-2010 (See OMB Historical Tables, Table 3.1) Figurefrom Peterson Foundation, excellent primer on budget: http://www.pgpf.org/Special-Topics/Spending-primer.aspx
State and Federal Revenue and Taxes • State revenue sources • Balance of federal taxes and federal spending per state
Historical Tax Rates by Income Group [NYTimes] by Catherine Mulbrandon on November 3, 2007, http://visualizingeconomics.com/2007/11/03/nytimes-historical-tax-rates-by-income-group/
Federal Income Taxes (2004) From, The American, American Enterprise Institute, Guess Who Really Pays the Taxes, By Stephen Moore From the November/December 2007 Issue, http://american.com/archive/2007/november-december-magazine-contents/guess-who-really-pays-the-taxes
All Taxes? Incomes and Federal, State & Local Taxes in 2009 Shares of TAXES AS A % OF INCOME Average Total Total Federal State and Total Cash Income Taxes Taxes Local Taxes Taxes Income Lowest 20% $ 12,400 3.5% 1.9% 3.6% 12.4% 16.0% Second 20% 25,000 7.1% 5.0% 8.7% 11.8% 20.5% Middle 20% 40,400 11.6% 10.2% 13.9% 11.3% 25.3% Fourth 20% 66,000 18.9% 18.9% 17.2% 11.3% 28.5% Next 10% 100,000 14.3% 15.2% 19.0% 11.1% 30.2% Next 5% 141,000 10.2% 11.2% 20.4% 10.8% 31.2% Next 4% 245,000 14.2% 15.8% 21.3% 10.2% 31.6% Top 1% 1,328,000 20.4% 22.1% 22.3% 8.4% 30.8% ALL 68,900 100.0% 100.0% 18.0% 10.6% 28.6% Source: Citizens for Tax Justice, http://www.ctj.org/pdf/taxday2010.pdf