Download
1 / 17
190 likes | 353 Vues
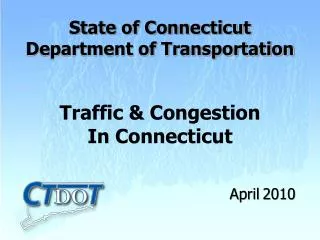
State of Connecticut Department of Transportation. Traffic & Congestion In Connecticut. April 2010. Overview:. State Route System As related to Local Roads Expressway System Arterials By Lane Miles of State Routes Vehicle Miles Traveled (VMT) Daily measure of traffic volume intensity

E N D
State of Connecticut Department of Transportation Traffic &Congestion In Connecticut April2010
Overview: • State Route System • As related to Local Roads • Expressway System • Arterials • By Lane Miles of State Routes • Vehicle Miles Traveled (VMT) • Daily measure of traffic volume intensity • Current and Projected (2030) Conditions • Volume to Capacity Ratio (V/C Ratio) • Hourly measure of congestion • Current and Projected (2030) Conditions • Annual Congestion Program Management Report is data source
Current State vs Locally Maintained Roads Total of 20,963 Miles 18% 82% Source: Connecticut Department of Transportation, Bureau of Policy and Planning, 2008 Congestion Management Program Report. Graphic revised as of April 2010.
Current State Route Miles - Total of 3,731 Miles 16% 84% Source: Connecticut Department of Transportation, Bureau of Policy and Planning, 2008 Congestion Management Program Report. Graphic revised as of April 2010.
Current State Route Lane Miles – Total of 10,274 Miles 23% 77% Lane miles are more directly related to maintenance effort / burden than route miles. Source: Connecticut Department of Transportation, Bureau of Policy and Planning, 2008 Congestion Management Program Report. Graphic revised as of April 2010.
Vehicle Miles Traveled (VMT) • (Average Daily Traffic) X (Length of Road Segment) • Daily indicator of road usage • Data for both State and Locally maintained roads • Current and Projected (2030) Conditions Source: Connecticut Department of Transportation, Bureau of Policy and Planning, 2008 Congestion Management Program Report. Graphic revised as of April 2010.
Current VMT for Expressways and Arterials 65 million vehicle miles traveled High VMT also adds to maintenance needs / burden of expressways 16% of roads carry 60% of traffic 60% 40% Source: Connecticut Department of Transportation, Bureau of Policy and Planning, 2008 Congestion Management Program Report. Graphic revised as of April 2010.
Current VMT for Expressways, Arterials, & Local Roads 86 million vehicle miles traveled 20,963 Total Miles 18 % 82% 45 % 31% 24% Source: Connecticut Department of Transportation, Bureau of Policy and Planning, 2008 Congestion Management Program Report. Graphic revised as of April 2010.
VMT for Expressways vs. Arterials 23 % Increase 27 % Increase 9 7 Source: Connecticut Department of Transportation, Bureau of Policy and Planning, 2008 Congestion Management Program Report. Graphic revised as of April 2010.
Current Statewide VMT By Metro Areas(Vehicle Miles Traveled) Danbury / Waterbury Southeast Northeast Hartford Stamford / Bridgeport New Haven VMT (Millions) Source: Connecticut Department of Transportation, Bureau of Policy and Planning, 2008 Congestion Management Program Report. Graphic revised as of April 2010.
Current Metro Area VMT by Expressway Vs. Arterial(Vehicle Miles Traveled) Hartford Metro Area experiences higher VMT on Arterial System than other areas 58% Stamford Bridgeport Metro Area experiences higher VMT on Expressways 71% 42% VMT (Millions) 29% Hartford Stamford / Bridgeport New Haven Danbury / Waterbury Southeast Northeast Source: Connecticut Department of Transportation, Bureau of Policy and Planning, 2008 Congestion Management Program Report. Graphic revised as of April 2010.
Volume to Capacity Ratio (V/C Ratio) • Basis for the Capacity Status in next few slides • Peak Hour Volume / Roadway Capacity • V/C Ratio is an hourly measure of congestion • Current and Projected (2030) Conditions Source: Connecticut Department of Transportation, Bureau of Policy and Planning, 2008 Congestion Management Program Report. Graphic revised as of April 2010.
Capacity Status – All State Routes Source: Connecticut Department of Transportation, Bureau of Policy and Planning, 2008 Congestion Management Program Report. Graphic revised as of April 2010.
Capacity Status – Expressways Source: Connecticut Department of Transportation, Bureau of Policy and Planning, 2008 Congestion Management Program Report. Graphic revised as of April 2010.
Current & Future Capacity Status – Expressways Source: Connecticut Department of Transportation, Bureau of Policy and Planning, 2008 Congestion Management Program Report. Graphic revised as of April 2010.
Current Connecticut V/C Ratio Source: Connecticut Department of Transportation, Bureau of Policy and Planning, 2008 Congestion Management Program Report. Graphic revised as of April 2010.
Current vs. Future Employment – V/C Ratio Source: Connecticut Department of Transportation, Bureau of Policy and Planning, Census Modeling. Graphic revised as of April 2010.