Download
1 / 31
310 likes | 450 Vues
Analysis of the 2 April 2006 Quasi-Linear Convective System (QLCS) over the Mid-Mississippi Valley Region: Storm Structure and Evolution from WSR-88D data.

E N D
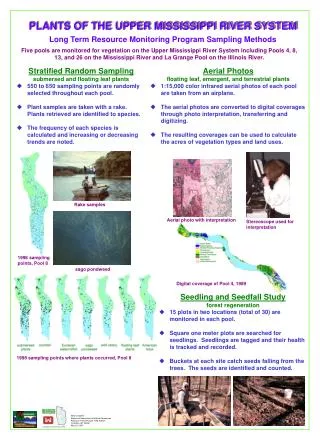
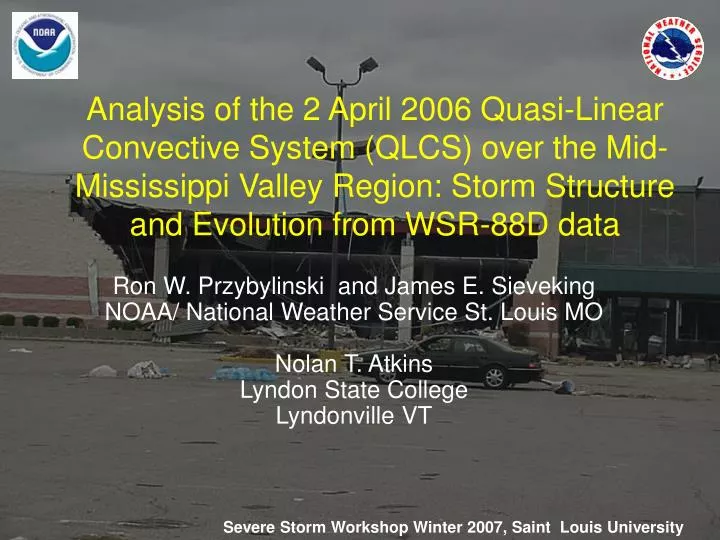
Analysis of the 2 April 2006 Quasi-Linear Convective System (QLCS) over the Mid-Mississippi Valley Region: Storm Structure and Evolution from WSR-88D data Ron W. Przybylinski and James E. Sieveking NOAA/ National Weather Service St. Louis MONolan T. AtkinsLyndon State College Lyndonville VT Severe Storm Workshop Winter 2007, Saint Louis University
It is 10 March 1986and you are the warningforecaster. You needto issue warnings from the conventional WSR-74C at WFO IND(125 nm range). What type of warnings would you Issue based on the conventional reflectivity data? Any particular locations?
2 April 2006 Outline • Storm Damage Assessment • Synoptic / Mesoscale Environment • Radar Analysis- Early Stages- Northeast of St. Louis- St. Louis Area and immediate southwest Illinois(metro east) • Summary
Some Findings: • 9 tornadoes occurred within the WFO LSX CWA(with many of these tornadoes occurring along theleading edge of the squall line). • Tornadic damage ranged from F0 to F2 intensity • F2 damage intensity occurred in Fairview Heights and east of the O’Fallon Illinois area. • The longest tornadic damage track occurred over Montgomery County Illinois (20 miles long). • 2 fatalities (one in St. Louis County and the other in Fairview Heights Illinois) and 20 injuries occurred with this event.
Most of our damaging wind reports with organized convective lines occur between 4:00 PM – 8:00 PM
Most of our squall line (non-supercell) tornadoes also occur between 4:00 PM and 8:00 PM CDT.
Sounding Analysis from KSGF at 1800 UTC CAPE = 2056 J/kg BRN = 43.7 0-5 km Bulk Shear 27 m s-1 (54 kts) 0-3 km Bulk Shear 16 m s-1 (32 kts) 0-3 km SR Helicity 215 m2 s-2
What was the degree of instability on this day?From SPC mesoanalysis At 1900 UTC (2:00 PM) MLCAPE /MLCIN analysis showed the greatestinstability was located over central Missouri 1500 - 2000 J/kg. At 2100 UTC (4:00 PM) Axis of highest instability extended from southeast Iowathrough east central Missouri1500 – 2000 J/kg. www.spc.noaa.gov/exper/mesoanalysis
Along warm or near stationary frontal boundarieswe frequently observe strong thermal gradients which supports potential fornear surface and low-level rotation. From Markowski et al. 1998
0-1 km Storm-relative helicity (SRH)for 2:00 PM CDT from SPC. Axis of highest values are aligned with the warm frontal boundary from northeast Missouri through south-central Illinois. Units m2 s-2 0-3 km Storm-relative helicity (SRH) (deeper layer) for 2:00 PM CDT. Axis of highest values are similar to 0-1 km SRH from northeast Missouri through south-central Illinois.
0-1 km Storm-relative helicity (SRH)for 4:00 PM CDT. Magnitudes of SRH increased from 2:00 PM CDT. Again the axis strongest values were aligned along the warm frontal boundary – west central throughsouth-central Illinois. 0-3 km Storm-relative helicity (SRH)(deeper layer) for 4:00 PM CDT.Similar to the 0-1 km SRH image the axis of highest magnitudes werealigned along the warm frontal boundary.
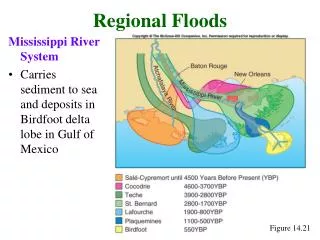
Radar Composite including mesovortices 1 through 10 and tornado tracks(shown in red). Except for MV 1 and MV 7 the tornadic mesovortex tracks in the 2 April case revealed longer paths compared to the 10 June 2003 St. Louis bow echo case during BAMEX. 3:30 PM 4:30 PM 5:30 PM
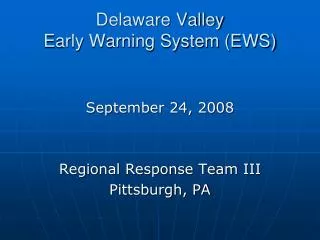
On this day, I was traveling southbound on I 55 headingtowards STL. With the approaching line of storms I stoppedand positioned myself just northeast of Staunton Illinois.
Viewing southwest towards the town of Staunton IL. No Shelf Cloud Yet!!!
Approaching Shelf Cloud from the southwest. Viewingsouthwest towards the town of Staunton IL.
Viewing south – Shelf cloud overhead. Any possible rotation with the shelf cloud? Winds estimated 50 to 60 mphwith hail (dime size) at this time. I- 55 is just to the left.
A Wall Cloud along the leading edge of the large bow echo near Springfield Illinois (April 2, 2006).
Mesovortices #2, 3, 4 and 5 over southwest Illinois; 55 km NNE of KLSX over Macoupin County IL. Light blue contours represent tornadic damage path. Light blueand black contour signifies path of mesovortex.
KLSX planview reflectivityand cross-section at 2226 UTC (Images from WDSS-II). Multicell evolution noted along theleading edge at this time. KLSX plan view base velocity and cross-sectionat 2226 UTC. MesoscaleRIJ appears to be descendingto near the surface at this time.
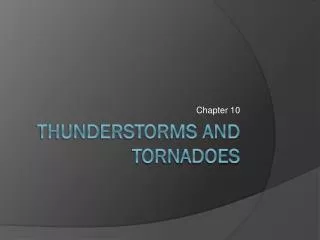
VELOCITY CROSS SECTION DESCENDING REAR INFLOW JET (RIJ) Mesoscale RIJ originated near 4.0 km (white – light gray area greater than 70 kts) then descends to near the surface as to line approaches western St. Charles and St. Louis counties.
Mesovortices #5, 6, and 7 over Metro East Fairview Heights and O’Fallon Illinois are located along the path of MV #6 (Light blue region).
Summary • 2 April 2006 Tornadic QLCS was one of the most challenging severe weather episodes in recent history. • Widespread wind damage occurred over parts of east-central Missouri, while much of the higher intensity damage over southwest Illinois occurred along the paths of the mesovortices (circulations). • Tornadic damage ranged from F0 – F2 intensity. • Two fatalities and 20 injuries occurred.
Summary Continued • Tornado touchdown occurred at or just after the initial identification of the mesovortex. (Thus very limited lead time for warnings in this case). • Rapid convective line motion combined very small mesovortex core diameters and weak to moderate intensity rotational velocities lead to the complexity of the April 2nd tornadic case. • Of the 38 cases studied over the Mid-Mississippi Valley Region, this case could be placed near the far left end of the spectrum of cases.