Download
1 / 51
510 likes | 648 Vues
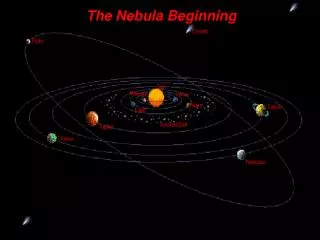
SWRI presents a KUIPER BELT DOUBLE FEATURE…. The Ice Volcanoes of Charon. It Came from the Inner Nebula. and. Starring STEVE DESCH, Arizona State University School of Earth and Space Exploration. A NASA Origins of Solar Systems production. Opens July 29, 2008.

E N D
SWRI presents a KUIPER BELT DOUBLE FEATURE… The Ice Volcanoes of Charon It Came from the Inner Nebula and Starring STEVE DESCH, Arizona State University School of Earth and Space Exploration. A NASA Origins of Solar Systems production. Opens July 29, 2008.
Mass Distribution and Planet Formation in the Solar Nebula Steve Desch School of Earth and Space Exploration Arizona State University Lunar and Planetary Science Conference March 12, 2008
Outline • Minimum Mass Solar Nebula • Nice Model of Planet Migration • Updated MMSN Model of Desch (2007) • Implications for Disk Evolution, Particle Transport, and Planetary Growth • Summary
Minimum Mass Solar Nebula It is essential to constrain the distribution of mass in the solar nebula. Pressures in region where meteoritic components formed (e.g., conditions of chondrule formation) Densities of solids and gas in outer solar system (e.g., formation of giant planets) Distribution of transport of mass (what caused the disk to evolve?) Many authors developed Minimum Mass Solar Nebula (Edgeworth 1949; Kuiper 1956; Safronov 1967; Alfven & Arrhenius 1970; Weidenschilling 1977; Hayashi 1981; Hayashi et al. 1985) Model of Weidenschilling (1977) is well developed...
MMSN: H and He are added to planet masses until they have solar composition, The augmented mass then spread out over the annuli in which they orbit. Surface density roughly (r) ~ r-1.5 Hayashi et al. (1985) widely used: (r) = 1700 (r / 1AU)-1.5 g cm-2 = 54 (r / 10 AU)-1.5 g cm-2 Weidenschilling (1977)
A Few Problems with the MMSN Densities in MMSN model are not consistent with pressures expected for chondrule formation (Desch & Connolly 2002) Models of formation of Jupiter’s core routinely have to increase solids densities from canonical value (1 - 2 g cm-2) to ~ 10 g cm-2(e.g., Pollack et al. 1996) Not possible to explain formation of Uranus and Neptune cores within lifetime of disk, while H and He gas are available to accrete (Lissauer & Stewart 1993). Underlying assumption of MMSN - that planets’ current orbits reflect where mass was in the solar nebula - is wrong! Planets migrated! (Fernandez & Ip 1984; Malhotra 1993). Turns out, planets migrated a lot!! (Tsiganis et al. 2005)
Planetary Migration • The ‘Nice’ Model (Tsiganis et al. 2005; Gomes et al. 2005; Morbidelli et al. 2005; Levison et al. 2007, 2008) explains: • The timing and magnitude of Late Heavy Bombardment • Giant planets' semi-major axes, eccentricities and inclinations • Numbers of Trojan asteroids and irregular satellites • Structure of Kuiper Belt, etc. • IF • Planets formed at 5.45 AU (Jupiter), 8.18 AU (Saturn), 11.5 AU (Neptune / Uranus) and 14.2 AU (Uranus / Neptune) • A 35 M Disk of Planetesimals extended from 15 - 30 AU • Best fits involve encounter between Uranus and Neptune; in 50% of simulations they switch places
Planetary Migration 2:1 resonance crossing occurs about 650 Myr after solar system formation r (AU) 5 10 15 20 25 30
New Minimum Mass Solar Nebula Desch (2007)
New Minimum Mass Solar Nebula Disk much denser! Disk much more massive: 0.092 M from 1-30 AU; vs. 0.011 M Density falls steeply (as r-2.2) but very smoothly and monotonically! Matches to < 10%!! Consistent with many new constraints Desch (2007)
New Minimum Mass Solar Nebula Mass distribution is not smooth and monotonic if Uranus and Neptune did not switch orbits. Very strong circumstantial evidence that Neptune formed closer to the Sun Desch (2007)
New Minimum Mass Solar Nebula Steep profile (r) = 343 (r / 10 AU)-2.17 g cm-2 is not consistent with steady-state alpha accretion disk (Lynden-Bell & Pringle 1974) Implies p = 3/2 - q < 3/2
New Minimum Mass Solar Nebula In fact, if ~ r-p and T ~r-q and p+q > 2, mass must flow outwards (Takeuchi & Lin 2002) Desch (2007) solved steady-state equations for alpha disk (Lynden-Bell & Pringle 1974) with an outer boundary condition due to photoevaporation. Found a steady-state alpha disk solution if solar nebula was a decretion disk Two parameters: (~ 3 x 10⁻⁴), and disk outer edge rd (~ 50 AU)
New Minimum Mass Solar Nebula Steady-state alpha decretion disk fits even better. Applies in outer solar system (> few AU) Applies when large planetesimals formed and dynamically decoupled from gas (a few x 105 yrs) Small particles will trace the gas and move outward in a few Myr
Explains presence of CAIs in comets! Comet 81P/Wild 2Scattered into present orbit in 1974; was previously a member of the Kuiper Belt Scattered Disk Probably formed at 10-30 AU Zolensky et al (2006) Stardust Sample Track 25 called ‘Inti’. It’s a CAI, formed (by condensation) at > 1700 K.
New Model Explains Rapid Growth of Planet Cores • Planets form closer to Sun in Nice model: orbital timescales faster • Density of solids higher than in traditional MMSN • Higher gas densities damp eccentricities of planetesimals, facilitating accretion • Desch (2007) calculated growth rate of planetary cores using formulism of Kokubo & Ida (2002). • Tidal disruption considered; assumed mass of planetesimals ~ 3 x 10¹² g (R = 0.1 km, i.e., comets).
Cores grow in 0.5 Myr (J), 2 Myr (S), 5-6 Myr (N) and 9-11 Myr (U) • Even Uranus and Neptune reach 10 M before H, He gas gone Desch (2007)
Masses of Solids in Planets Inside 15 AU, planets limited by availability of solids; they achieve isolation masses Outside 15 AU, planets cannot grow before gas dissipates; no gas = no damping of eccentricities Desch (2007)
Summary Past planet migration implies solar nebula was more massive and concentrated than thought. Using Nice model positions, Desch (2007) found new MMSN model. Mass ~ 0.1 M, (r) ~ r-2.2. Strongly implies Uranus and Neptune switched orbits. Cannot be in steady-state accretion; but (r) is consistent with outer solar system as a steady-state alpha decretion disk being photo-evaporated at about 60 AU (like in Orion) Dust (read: Inti) would have moved from a few AU to comet-forming zone in a few Myr All the giant planet cores could reach 10 M and accrete H, He gas in lifetime of the nebula
Cryovolcanism on Charon and other Kuiper Belt Objects Steve Desch Jason Cook [now at SwRI], Thomas Doggett, Simon Porter School of Earth and Space Exploration Arizona State University
Can KBOs experience cryovolcanism? • A few words about cryovolcanism. • A description of our model to calculate the thermal evolution of KBOs • Results for Charon, including analysis of the physics • Likelihood of subsurface liquid on other KBOs. • Outline of a process for bringing liquid to the surface. KBOs the size of Charon or larger can retain subsurface liquid to the present day, and may even be experiencing cryovolcanism, provided they formed with moderate amounts of ammonia.
Crystalline Water Ice = Cryovolcanism? Crystalline water ice observed on many large KBOs Crystalline water ice is expected to be amorphized by cosmic rays doses of 2-3 eV/molecule (Strazzulla et al. 1992; Mastrapa & Brown 2006), which takes < 3 Myr in Kuiper Belt (Cooper et al. 2003). Once amorphized, KBO surfaces stay amorphous because of low temperatures. Cook et al. (2007) reviewed annealing mechanisms. Most favorable was micrometeorite impacts, but all of them were found unable to compete with cosmic-ray amorphization.
Crystalline Water Ice = Cryovolcanism? • Cook et al. (2007) intepreted crystalline water ice as diagnostic of cryovolcanism on KBOs. This would be incorrect IF • Dust fluxes were > an order of magnitude larger than interplanetary dust flux, as is possible in planetary environments. (2003 EL61 collisional family, too?) • Real ices don’t conform to experiments of amorphization
Cryovolcanism? Still, cryovolcanism does exist. Ariel’s surface < 100 Myr old (Plescia 1989), Triton’s even younger (Schenk & Moore 2007) Are these objects tidally heated, or are young surfaces common on KBOs, too??
Cryovolcanism needs ammonia X = NH3 / (H2O+NH3). Maximum cosmochemical value is X ≈15% (Lodders 2003). Models of molecular cloud chemistry predict N2 is efficiently dissociated, converted into NH3 (Charnley & Rodgers 2002). [Depletion of N2 recently confirmed observationally (Maret et al. 2007).] Models predict ~ 25% of all N in NH3 ices, for X ≈ 5% Observations of 9.3 micron band of ammonia ice suggest X = 5 - 10% (Gibb et al. 2001, Gurtler et al. 2002), but are disputed (Taban et al. 2003). Comets show X < 1.5%, but may be devolatilized. Ammonia content of KBOs is unknown, but X = 5% is not unreasonable
Description of Model Model updates internal energy in zone i: Qi(t) = rate of heating by long-lived radionuclides Fluxes into zone i (Fi-1) and out of zone i (Fi) found assuming thermal conduction: “Equation of state” is used to convert E back into temperature
Ammonia We use simplified phase diagram to include following phases: Solid water ice Solid ammonia dihydrate (ADH) Liquid water Liquid ammonia Rock (analogs being ordinary chondrites)
Ammonia Energy added to each zone goes into heating components via heat capacity, or into latent heats due to phase transitions. Each shell with mass M has energy E at the end of each timestep. We then find temperature T and fraction of mass in each (non-rock) phase that is consistent with this E: k refers to regime in phase diagram
Ammonia For example, in regime 1 (T< 176-dT K), Similar (but much more complicated) expressions apply to other regimes
Ammonia For example, in regime 3 (176+dT < T < Tliq),
Ammonia Hunten et al (1984) Just a few % ammonia drastically lowers the viscosity, especially once ADH melts. Limit for meter-sized rocks to slip ~ 10 km/Myr Arakawa & Maeno (1994)
Differentiation If the ice contains a few % ammonia, differentiation can occur wherever T > 176 K Maximum radius at which T=176 K ever = “Rdiff” Within Rdiff, we separate into rocky core, then ADH +ammonia+water = “slush” layer, then water ice on top. Undifferentiated rock-ice crust lies outside Rdiff. ADH denser than its melt, so slush layer well mixed; we mix compositions and internal energies after each timestep (this mimics convection).
Radiogenic Heating We consider heating by long-lived radionuclides 235U, 238U, 232Th and 40K only. Avg heating during first 1 Gyr = 5 x Avg heating during last 1 Gyr!
Thermal conductivities Rock We use values measured for ordinary chondrites at low temperatures (100 - 500 K) by Yomogida & Matsui (1983): k ≈ 1.0 W/m/K, independent of temperature Water Ice k = 567 / T W/m/K (Klinger 1980) Ammonia Dihydrate (ADH)k = 1.2 W/m/K (based on Lorenz & Shandera 2001) Water / Ammonia Liquids assumed to be convecting; k set to high value k =40 W/m/K ConvectionWe check for convection in water ice layer, but Ra << 1000 in all models we ran: no convection.
Thermal conductivities Conductivities of non-rock components combined using geometric mean, using volume fractions Conductivities of rock and ice components combined using percolation theory formula of Sirono & Yamamoto (2001) Conductivity of undifferentiated rock-ice mixture on Charon well described by k(T) = 3.21 (T/100 K)-0.73 W/m/K
Results Canonical case, a Charon-like body R = 600 km = 1.7 g cm-3 (rock fraction 63%) X = 5% Differentiation starts at t=65 Myr, reaches fullest extent by 100 Myr Rdiff = 516 km... half the mass differentiates
t=2 Gyr t=1 Gyr slush layer t=3 Gyr t=4 Gyr water ice layer t=4.6 Gyr ice+rock crust rocky core t=0 Gyr
rocky core slush layer water ice layer ice+rock crust H2O(s) rock rock H2O(l) + NH3(l) + H2O(s) H2O(s) + ADH ADH
All ammonia within Rdiff liquid; additional water liquid created as temperatures rise. Melted ADH Temperatures in slush layer drop below ~ 176 K; freezing starts at t = 4.5 Gyr Differentiation takes place within ~ 70 Myr
Present-day steady-state radiogenic heat flux at surface would be F = 1.216 erg cm-2 s-1. Analytical estimate of temperature at base of ice shell would be T = 100 (0.961)5.435 exp(0.401) = 129 K. Flux is enhanced over steady-state radiogenic heat flux by amount F by release of heat from rocky core. Temperatures in ice shell and in undifferentiated crust explained to within 1% by model with ≈0.42. Temperature at base of ice layer now predicted to be T = 100 (0.961+0.063)5.435 exp(0.401+0.633) ~ 182 K. Release of heat from core found to enhance flux by amount ≈0.42 Release of stored heat from core is significant!
Our model is highly favorable to maintenance of subsurface liquid: • Undifferentiated crust containing half the rock (as well as ADH) is thermally insulating (compared to pure water ice). • Core containing the other half of the rock---and its radionuclides---concentrates and stores heat • Release of stored heat and latent heat of freezing is significant, and demands a time evolution model. • These physical effects would not be captured in a steady-state, fully differentiated model.
61 T P M?, S? E C Q? O
Lots of uncertainties in freeze-out times: • Thermal conductivity of rock: x2 variation changes freeze-out time by ~ 0.3 Gyr • Raising ammonia to X=5% extends time of liquid by ~0.1 Gyr • Inclusion of methanol would increase freeze-out time by about 1 Gyr!
How does subsurface liquid surface? Crawford & Stevenson (1988) use linear elastic fracture mechanics to show that the stress intensity at the tip of a fluid-filled crack of length l, extending from base of ice layer (top of subsrface ocean), is If this exceeds Kc = 6 x 10⁸ dyne cm-3/2, the crack will self-propagate.
How does subsurface liquid surface? On Europa, ∆ = 1.00 g cm-3 - 0.92 g cm-3 > 0, and tension T is needed to initiate a crack. The crack has a maximum possible length. In our models, ∆ = 0.88-0.95 g cm-3 - 0.935 g cm-3 < 0 (if liquid > 230 K), and buoyancy can drive the crack all the way to the surface. Trapped pockets of liquid also create huge over-pressures when they freeze (Fagents et al. 2003) Cracks will propagate at several m/s (Crawford & Stevenson 1988), reaching the surface in ~ 1 day.
How does subsurface liquid surface? Cracks as small as 1 km can become self-propagating within Charon’s ice layer. Cracks are likely to be initiated during freezing of slush layer, when its volume must increase by 7%. Displacement of 7% of ~ 1022 g of liquid over 2.5 Gyr would coat Charon’s surface with water-ammonia ices to depth ~ 5 cm / Myr = 350 um in only 7 kyr. Total depth ~ 0.1 km total). Heat flux carried to surface only 0.001 erg cm-2 s-1, too small to affect thermal evolution.
cracks form here Conclusions Basic structure of KBOs 400-800 km in radius thermally insulating, undifferentiated rock-ice crust pure water ice layer, convects early on ADH - ammonia - water layer hot rocky core