Download
1 / 25
250 likes | 342 Vues
Variability in the physical structure, ocean chemistry, plankton ecology and commercial fish species of the seas surrounding Ireland between 1997 and 2010. G. Nolan 1 , K.Lyons 1 , S.Fennell 1 , T. Mc Grath 1 , D.Guihen 2 , C.Cusack 1 , C. Lynam 3. ICES/NAFO Decadal Symposium, Santander

E N D
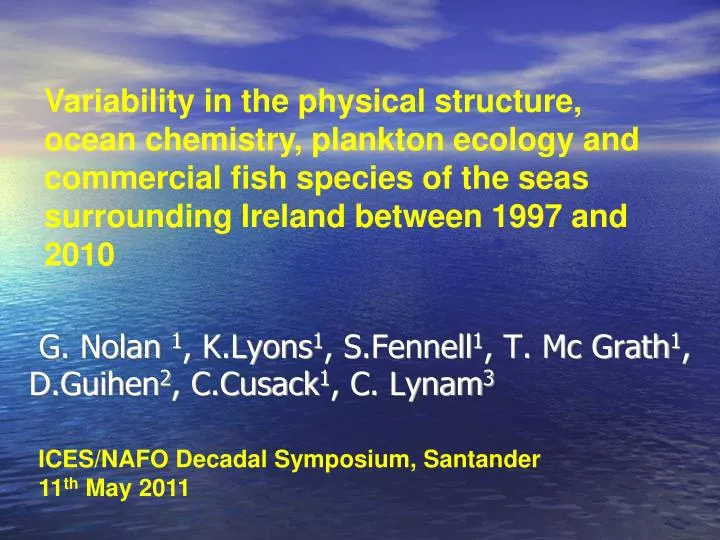
Variability in the physical structure, ocean chemistry, plankton ecology and commercial fish species of the seas surrounding Ireland between 1997 and 2010 G. Nolan 1, K.Lyons1, S.Fennell1, T. Mc Grath1, D.Guihen2, C.Cusack1, C. Lynam3 ICES/NAFO Decadal Symposium, Santander 11th May 2011
Biogeographical provinces: Niall Mc Ginty et al., (Poster 78)
Trends in sea surface temperature (1890 - 2007) Local temperature anomalies extracted from HadSST2. Malin head data is overlain in red (Note apparent 60 year cycle in N. Atlantic) • Recent intense warming in the NE Atlantic attributed in part to the AMO (Atlantic Multidecadal Oscillation), and in part to global warming. • Sub-polar gyre cooled over the 1955-2003 period, consistent with predominantly positive NAO
Cannaby H, Husrevoglu YS (2009) The influence of low-frequency variability and long-term trends in North Atlantic sea surface temperature on Irish waters. ICES J Mar Sci:fsp062
4 1 3
SAIW 2010 Porcupine Bank Station depth = 3000m MEDW 2007
Development of suitable growth conditions in Spring using SST as an indicator Spring Bloom timing Timing of Spring in Julian Days 1:Interannual variations on the date SST reaches 10 C 2:General Trend in coastal waters that it is arriving earlier 3:Abiotic conditions important in spring (water column structure and nutrient availability) 05 June 15 April 1959 – 2005 2006-2007 Winter: Land vegetation greening occurred 10 days earlier than the average over the past three decades (Geophs. Res. Lett. 2008) Maignanet al. (47 years daily SST data).
Phytoplankton colour and HAB species The percentage occurrence of Karenia mikimotoi during the winter months has increased since 2000 Total annual abundance of harmful and toxic species varies greatly between years An increase in phytoplankton biomass is evident in the northern Celtic Sea, based on Continuous Plankton Recorder (CPR) data, since 2000
Warm >>>>>>>>>> cold Zooplankton changes: Beaugrand view of whole region Specific look at warm water species in Irish waters (on the increase) mean abundance in Celtic Sea : The abundance of a common warm water species (Calanus helgolandicus) has increased to the southeast of Ireland Annual March p < 0.05
Poor cod distributions 2003/4 vs 2006/7 (possible indicator species) Poor cod and lesser spotted dogfish have increased to the north of Ireland and decreased to the south and are suitable candidate climate indicator species
Decline in cold-water species of fish and increase in warm-water species (Kendall tau plot) eg. Boarfish Fishery effects must be considered and long-term data is required to detect such change Red= expected distribution Blue= actual
Pipefishes (Syngnthidae) – related to seahorses A symptom of major ecosystem changes? Possibly linked to SST rises? Largely absent from samples 1958-2001 Increase in catch in 2003, 2004, 2005
Migratory fish species Salmon – declining marine survival since the 1970s Sea trout – stock collapse in 1980s, with adult returns still at a low level
Higher phosphate values on WOCE cruises AABW signal Higher surface nutrients in more recent cruises
Warming trend with AMO signal apparent at Malin Head • LSW (freshened between 2004 and 2009 and then increased salinity in 2010 and 2011) • Changes in temperature are mirrored in biological data sets • Increases in the annual numerical abundance of diatoms and dinoflagellates are evident in all coastal regions since 1998. • Warm water fish species more prevalent • Decline in migratory fish returns • Some differences in nutrient concentrations when comparing WOCE data with 2008-2010 data Conclusions