Smart Transportation Pricing: Value Case Study
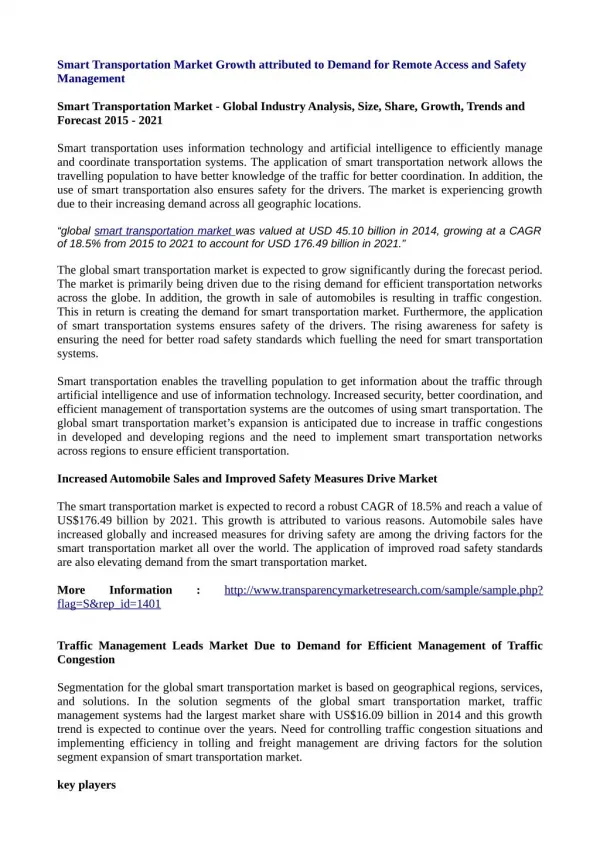
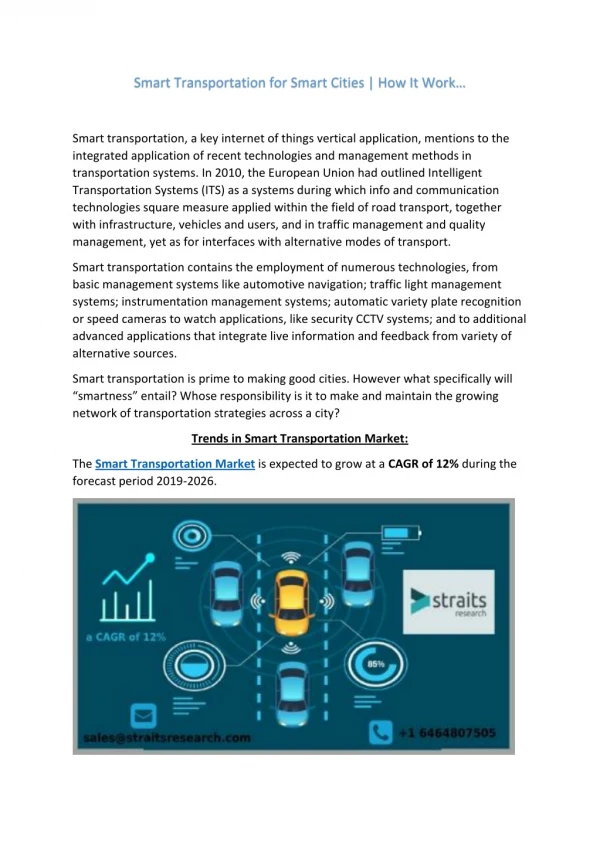
Explore the impact of smart transportation pricing on traffic volume, speed, and emissions reduction for sustainable urban mobility. This case study analyzes the economic and environmental benefits of adopting smart transportation systems.

Smart Transportation Pricing: Value Case Study
E N D
Presentation Transcript
Smart Transportation Pricing- Value Case Cisco Internet Business Solutions Group - December 2008
Carbon Excellence Service Excellence Service adoption and retention Cost Quality Delivery Closed Economic Profit 80% Passenger Impact Loop Revenue Impact Adoption and Utilization Systems x Node • Performance • Cost (internal/external) • Utility • Data Integrity • Risk Management (ID and Mitigation) Operational Excellence Value Monitor Return on Invested Capital Value Drivers
Short-Term • Total decreased traffic volume • Total decreased VKT • Increased public transport volume Traffic VolumeReduction Avg. SpeedIncrease Emission Reduction 2.92% 1.52% 4% + Longer-Term • Less use of Energy • Less use of Space Package-based Program Building Smart Transportation (Packaged Program) Total Impact Smart Transportation Pricing Mobility Management Traffic VolumeReduction Avg. SpeedIncrease Emission Reduction 13.7% 5.42% 17% Smart Work Center MobilitySubstitute • Decreased Traffic Volume • Increased Public Transport Volume Mobility Alternatives Connected Bus Traffic VolumeReduction MobilityMarketing Personal Travel Assistant Avg. SpeedIncrease Emission Reduction 12.68% 12.8% 6.3%
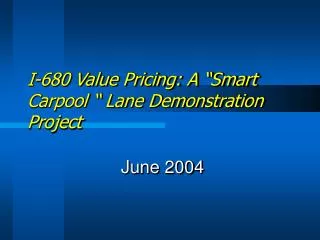
Charging: 4,000 won fixed Analysis Time Period: 07:00~21:00 Toll gate Smart Transportation PricingImpact Analysis Traffic Impact Environmental Impact
Emission Calculation Procedure • EF (Emission Factor) for each pollutant: a function of vehicle speed, depending on vehicle types and fuels. For example, EF for a private car fueled by gasoline: EF(CO2) = 1248.4 x (Avg. Speed)^(-0.4845) EF(NOx) = 3.4578 x (Avg. Speed)^(-0.7978) Avg. Speed (km/hr) Avg. Transit Time (hr) Traffic Vol. Etc. ( truck & van using diesel) Bus (diesel) Private Car (gasoline) EF (g/km) EF (g/km) EF (g/km) Emission (g) = EF x Avg. Speed x Avg. Transit Time x Traffic Vol.
Smart Transportation Pricing Scenario Analysis Analysis Area: The Center of Seoul (About 6.38 km2 of Jongno-Gu~Jung-Gu) Input Data: Survey Data from SDI in 2005 O/D : Passenger Car, Bus, Taxi, Subway, etc Network 27% Reduction of Passenger Cars by Imposing on Inflow Vehicles Analysis Time Period: Whole Dayin the Time(07:00~21:00) Analysis Indices: Average Travel Speed, Average Travel Time, VKT, Traffic Volume
NOx (kg/day) PM10 (kg/day) CO2 (tons/day) Base 2327 59 757 Scenario #1 1924 49 633 Differnce(sc1-b) -403 -10 -124 % Change -17% -17% -16% Impact on Transportation & Environment Transportation Avg. Travel Speed (km/h) Avg. Travel Time (min) VKT (pcu·km) Total Volume (pcu/day) 9.58 15.6 1,549,499 5,519,189 Base Scenario #1 10.10 (5.42% increase) 14.8 (5.13% decrease) 1,340,622 (13.4% decrease) 4,762,991 (13.7% decrease) Environment
Smart Transportation Pricing ScenarioChange of Traffic Volume Difference of Traffic Vol. (pcu/day) Scenario1 - Base % Change of Traffic Vol. (Scenario1 – Base)/Base