Download

1 / 17
170 likes | 281 Vues
Learn how schools are graded and held accountable based on various indicators like proficiency, growth, and academic indicators. Explore the scoring system and see how schools compare to state averages.

E N D
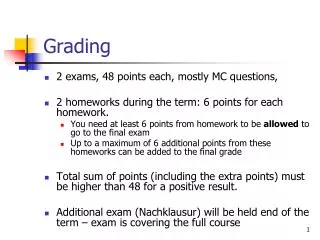
A-F Grading Model What we know… Presented: January 5, 2012
Remember: • Schools are held accountable every day using a lot of different tools. • There is something to be learned from every accountability system. • This is only one tool of many and we will continue to ask questions and evaluate this system so we better understand what it means and how it can improve academic achievement. • However, we never make all our decisions based on one indicator, and will continue to evaluate the entire school on a regular basis just like we always have. • There are some things we know and some things we do not. Here’s what we know:
Current Standing – Status % Proficient (25 points) • Two components: • Status % proficient 25 points • % proficient using VAM 15 points • Status % proficient • % of students proficient reading x 12.5 +% of students proficient math x 12.5 = total out of 25
% Proficient using VAM (15 points) • % proficient using VAM • This is calculated similar to how RDA calculates your statistical peers for AYP • This means your school is compared to other schools that are like it in the state • Gender, Race/Ethnicity, FRP, SPED, ELL, FAY • Considering these characteristics, PED predicts how well your school and schools similar to you should perform • If you meet or exceed the predicted target, you receive a higher percentile ranking…
% Proficient using VAM (15 points) School A and School B are similar schools Prediction = 75% proficient in Reading, 75% proficient in Math School ASchool B 65% in Reading 85% in Reading 65% in Math 85% in Math *perform below prediction *perform above prediction School A School B (30th percentile in rank) (70th percentile in rank) Reading points x .30 + Reading points x .70 + Math points x. .30 = total Math points x .70 = total **Reading points = 7.5 **Math points = 7.5 All schools in the state
Why is it Fair to Compare me to the Rest of the State? • The target for your school is based on your school’s characteristics • All schools that are similar in demographics get the same targets • Therefore, PED can rank all the schools in the state on the same scale • You then get ranked on how well you met your target
School Growth (10 points) • Again, this uses a VAM so it compares you to other schools that are similar to your school • PED predicts how much your school should improve year over year • If your school met or exceeded that prediction, you receive a higher percentile ranking
School Growth School A and School B are similar schools Prediction = growth should be 2% points every year for the last 3 years School ASchool B 2009 = 75% R, 75% M 2009 = 75% R, 75% M 2010 = 76% R, 76% M 2010 = 78% R, 78% M 2011 = 76% R, 76% M 2010 = 81% R, 81% M *perform below prediction *perform above prediction School A School B (30th percentile in rank) (70th percentile in rank) Reading points x .30 + Reading points x .70 + Math points x. .30 = total Math points x .70 = total **Reading points = 5 **Math points = 5 All schools in the state
Growth of Highest Performing Students (20 Points) • Highest 75% of students at your school • Again, this uses a VAM so it compares one student to a similar student in the state • PED predicts how well these students should perform and grow every year over the last 3 years • That prediction is 0 because the average across the state would be that you learned one year of knowledge in one year, no more, no less • If the score is positive, the students met or exceeded that prediction and you receive more points • If the score is negative, the students did not meet the prediction and the fewer points you receive
Growth of Lowest Performing Students (20 Points) • Lowest 25% of students at your school • Again, this uses a VAM so it compares one student to a similar student in the state • Important: These students carry more weight than your highest 75% • 100 students at a school – • High 75 students = 20 points • Low 25 students = 20 points (*the individual student in the lowest 25 has a bigger impact in your grade than the higher 75) • PED predicts how well these students should perform and grow every year over the last 3 years • That prediction is 0 because the average across the state would be that you learned one year of knowledge in one year, no more, no less • The more students that met or exceeded that prediction, you receive a higher percentile ranking • The further the student group is from zero, the less points you receive
Other Academic Indicators (10 points) • Attendance based on unexcused absences = 5 points • Opportunity to Learn Survey = 5 points • Survey is not available in this grade, so all 10 points is derived from attendance • PED sets a 95% attendance target for all schools in the state • (Your school attendance rate / .95) x 10 = total • If your school exceeds 95% attendance, you will receive more than 10 points
Bonus Points (+5 Points) • Not awarded • Available in 2012
Graduation Rate (9 points) • PED sets target of 95% for 4 year cohort • (four-year cohort graduation rate / .95) x 8 = total • PED sets target of 95% for 5 & 6 year cohort • (five-year & six-year cohort graduation rate / .95) x 4 = total
Graduation Growth (5 points) • Again, this uses a VAM so it compares one school to a similar school in the state based on demographics • PED predicts what your school’s graduation rate growth should be from year to year • This calculation is done exactly the same as school growth was done
Career and College Readiness (15 points) • Participation (5 points) • (number of students who participate in any one of the qualified classes or activities / number of eligible students) x points available = total points • Success (10 points) • (number of students who participated and who met the benchmark / number of total students who participated) x points available = total points