(a)
(a). (c). (b). (d). Modeling Studies of Photoionization Experiments Driven by Z-Pinch X-rays Nathan Shupe and Professor David Cohen Department of Physics and Astronomy, Swarthmore College. X-ray Photoionized Nebulae. Helios Non-LTE Hydro Simulations. Gas Cell Experiments.

(a)
E N D
Presentation Transcript
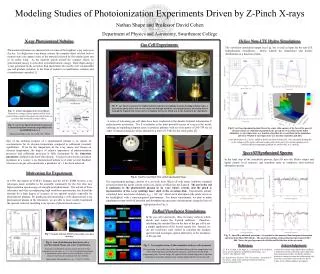
(a) (c) (b) (d) Modeling Studies of Photoionization Experiments Driven by Z-Pinch X-rays Nathan Shupe and Professor David Cohen Department of Physics and Astronomy, Swarthmore College X-ray Photoionized Nebulae Helios Non-LTE Hydro Simulations Gas Cell Experiments The viewfactor simulation output (see Fig. 8a) is used as input for the non-LTE hydrodynamic simulations. Helios outputs the temperature and density distributions as a function of time. Photoionized plasmas are characteristic of some of the brightest x-ray sources in the sky. In a high mass x-ray binary system, the compact object (a black hole or neutron star) can capture some of the material released by the nearby giant star in its stellar wind. As the material spirals toward the compact object, its gravitational energy is converted to thermal kinetic energy. Hard (high-energy) x-rays generated in the accretion disk photoionize the nearby cool circumstellar gas and produce radiation in the form of radiative recombination continua and recombination cascades [1]. (b) (a) (a) (c) Fig. 5: (a) The Z Accelerator at Sandia National Laboratories banking its pulse-forming switches before a shot, (b) the anode insert and current return can through which the current pulse passes after being driven through the Z-pinch wire array, and (c) a tungsten wire array which acts as the Z-pinch in the experiment. Fig. 1: Artist Conception of an X-ray Binary.Pictured is a compact object captures stellar wind material from a nearby blue giant star which forms an accretion disk around the compact object. (b) A series of ride-along gas cell shots have been conducted at the Sandia National Laboratories Z pulsed power accelerator. The Z accelerator is the most powerful source of x-rays in the world, utilizing an imploding tungsten array to produce plasmas with an x-ray power of 290 TW for an order 10 nanosecond pulse which amounts to a total of 1.9 MJ for the entire pulse [2]. Fig. 2: (a) X-ray Spectrum and (b) Contours of Constant Ionization Parameter (logarithmic) for the HMXRB Vela X-1. Figures from Sako et al. Ap.J., 525, 921 (1999). Fig. 8: (a) Time-dependent incident flux at the center (blue square) of the face of the gas cell, (b) mass density as a function of position in the gas cell for several times in the hydro simulation, (c) ion temperature as a function of position for several times in the simulation, and (d) a 3-D plot of ion temperature as a function of position and time. In the hydro plots (b, c, d), the radiation field is incident from the left. Note the shock heating due to the collapse of the mylar walls and compression of the gas in (b), and the radiation wave evidenced by the temperature gradient for earlier times in (c) and (d). One of the defining features of a photoionized plasma is its degree of overionization for its electron temperature compared to collisional (coronal) equilibrium. If we fix the temperature of the x-ray source and choose an electron temperature, the degree of relative importance of photoionization processes and collisional processes is fully determined by the ionization parameter, defined as the local flux/density. A typical value for the ionization parameter in a cosmic x-ray photoionized nebula is of order several hundred, whereas in our gas cell experiments a parameter of ~ 5 has been achieved. Spect3D Synthesized Spectra In the final step of the simulation process, Spect3D uses the Helios output and inputs atomic level structure and transition rates to synthesize time-resolved absorption spectra. Motivation for Experiment Fig. 6: Top View and Pinch View of the Experimental Setup. In 1999, the launch of NASA’s Chandra and the ESA’s XMM Newton x-ray telescopes made available to the scientific community for the first time new high-resolution spectroscopy of astrophysical phenomena. The advent of these telescopes and their accompanying high resolution spectroscopy has fueled the demand for a high degree of accuracy in our spectral models, especially for photoionized plasmas. By producing and measuring a well-characterized x-ray photoionized plasma in the laboratory, we are able to more readily benchmark the spectral codes for modeling x-ray spectra of photoionized sources. The experimental package consists of a cm-scale neon filled cell with mylar windows, mounted several cm from the anode current return can, inside of which lies the Z-pinch. The gas in the cell is analogous to the photoionized plasma in an x-ray binary system, and the pinch is representative of the x-ray emitting inner shell of the accretion disk. Experiments already completed have used neon of density nion~ 1018 cm-3 observed in absorption (the pinch serves as the backlighter) with a time-integrated spectrometer. For future experiments, we plan to make simultaneous time-resolved emission and absorption spectroscopic measurements along the lines of sight pictured in Fig. 6. VisRad Viewfactor Simulations (a) In the gas cell experiments, there are many surfaces which absorb and reemit the Z-pinch radiation. Therefore, calculating the incident flux on the face of the gas cell is not a simple application of the inverse square law. Instead, we use the viewfactor code VisRad to calculate the incident spectrum and investigate spatial uniformity of the irradiance of the gas cell. Fig 3:Chandra (left) and XMM Newton (right) x-ray space telescopes. Fig. 9: Spect3D synthesized spectrum (red) matched to the measured time-integrated absorption spectrum from Shot Z543 (black).The spectral resolution of the synthesized spectrum is E/dE = 800. Notice the good agreement for H-like and He-like lines in the spectrum. (b) Fig. 4: Iron Model Emission Rate Spectra for a (a) Photoionized Plasma and a (b) Coronal Plasma. References Acknowledgements Fig. 7: Two snapshots from a VisRad simulation of the gas cell experiment. The top image is an earlier time in the simulation during the low temperature foot of the pinch emission, and the bottom image is a later time from the high-temperature peak. In each image, the right and left columns depict the Z machine diode/pinch assembly, and the center column depicts the face of the gas cell. Note that even though the electron density for each of these simulations was the same, ne = 1011 cm-3, the photoionized plasma is significantly cooler, and its spectra is marked by a lack of emission lines from de-excitations from the 3d orbital. Figures taken from Liedahl et al. Ap. J., 350, L37 (1990). [1] D. A. Liedahl, S. M. Kahn, A. L. Osterheld, W. H. Goldstein. X-ray spectral signatures of photoionized plasmas. ApJ, 350:L37-L40, February 1990. [2] Pulsed Power Facilities: The Z Accelerator – An Intense X-ray Source. [http://www.sandia.gov/pulspowr/facilities/ zaccelerator.html], 1998. I would like to thank Joseph MacFarlane and Prism Computational Sciences for their codes which make these simulations possible, Jim Bailey and Greg Rochau for sharing their data and collaborating with us on these experiments, and my advisor, David Cohen, for his endless guidance and support.