Download
1 / 30
300 likes | 466 Vues
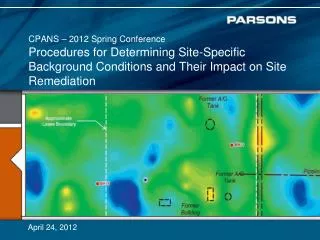
CPANS – 2012 Spring Conference. Procedures for Determining Site-Specific Background Conditions and Their Impact on Site Remediation. April 24, 2012. Authors and Presenter. Authors. Presenter. Anne G. Way Tai. T. Wong Yong Li James G. Carss. Anne Way, P. Chem. anne.way@parsons.com

E N D
CPANS – 2012 Spring Conference Procedures for Determining Site-Specific Background Conditions and Their Impact on SiteRemediation April 24, 2012
Authors and Presenter Authors Presenter Anne G. Way Tai. T. Wong Yong Li James G. Carss Anne Way, P. Chem. anne.way@parsons.com O’Connor Associates - A Parsons Company Calgary, Alberta
What is background? • Provincial and Federal Guidance • Methodology • Picking locations • Calculation • What about outliers? • Case studies Outline
What is Background? • Concentration of a substance in the environment that can be attributed to natural sources • Can also include anthropogenic sources, as long as they are not specifically related to site activities • Can vary regionally and locally based on the soil and bedrock present • So use of federal/regional background data for site-specific remediation is generally not a good idea
Provincial and Federal Guidance “Recommended” Procedures for Calculating Background
Methodology - Locations • Background locations need to match onsite conditions, but are unaffected by anthropogenic activities • As close in distance to site as possible • Can use non-impacted onsite areas in SOME cases (EPA 2002) • Not influenced by site activities (upgradient, up-wind, up-hill) • Match geological strata represented by site characterization data • Representative of range of soil samples to which they will be compared (more than one area may be required) • In most cases, this idealized background location does not exist EPA. 2002. Guidance for Comparing Background and Chemical Concentrations in Soil for CERCLA Sites. EPA 540-R-01-003, U.S. Environmental Protection Agency, Office of Emergency and Remedial Response, Washington, DC.
Methodology - Locations • Complications • Complex site history • Incomplete site characterization/conceptual site model • Minimal resources • Limited availability of background information • e.g., Sites located within cities • How many locations? • The more the better! • Larger number of samples more accurate estimate lower error rates
Methodology - Calculations • Histograms • Assess shape of data • Symmetric (normal distribution) • Skewed (logarithmic, other) • Assess spread of data • Tightly clustered around a certain value? • Stay within certain limits?
Methodology - Calculations • Box and whisker plots • Shows the shape, central tendency and variability of the data • Useful for comparing several data sets
Methodology - Calculations • Percentiles • The nth percentile has n % of the data below it and (100-n) % of the data above it • Based on your current data set • Will change with additional data • Prediction Limits (PLs) • The upper bound of the associated prediction limit (UPL) • “about 95% of the time, or I am 95% confident that, the next future observation taken will be less than X”
Methodology – What About Outliers? • “An observation that does not conform to the pattern established by other observations” (Hunt et al. 1981) • An unavoidable problem • Sources of outliers • Recording, transcription, data-coding errors • Calibration problems, unusual sampling conditions • Manifestations of larger spatial or temporal variability than expected • e.g., small-scale variability within individual soil samples • Indication of unsuspected contamination Hunt, W.F., Jr., Akland, G., Cox, W., Curran, Frank,N., Goranson, S., Ross, P. Sauls, H., and Suggs, J. 1981. U.S. Environmental Protection Agency Intra-Agency Task Force Report on Air Quality Indicators, EPA-450/4-81-015. Environmental Protection Agency, National Technical Information Service, Springfield, Va.
Methodology – What About Outliers? • May be • True measurements of conditions on-site • An actual error • Must identify which class the outlier falls into! • Both outlier tests and a qualitative review of field and laboratory data should be used to determine if the data point should be eliminated from the data set • Many different types of outlier analysis
Methodology – What About Outliers? • EPA (2002) recommends 5 steps to treat outliers • Identify extreme values that may be potential outliers • Box plots, histograms • Apply statistical tests • Dixon’s, Rosner’s, others…. • Review statistical outliers with qualitative field and laboratory data • Decide on their class (true measurement or error) • Conduct data analysis with and without outliers • Document everything! EPA. 2002. Guidance for Comparing Background and Chemical Concentrations in Soil for CERCLA Sites. EPA 540-R-01-003, U.S. Environmental Protection Agency, Office of Emergency and Remedial Response, Washington, DC.
Case Study 1 • Site in Alberta • Former oilfield facilities: well, pump jack, scrubber shack, storage tanks, pipelines • Currently agricultural land use • Stratigraphy: silt and/or clayey silt with inter-bedded discontinuous sand lenses • Fine-grained, fine-textured soils • Salinity related contaminants of concern in soil • Tier 1 Salt Contamination Remediation Guidelines (SCARG) evaluation • Need to calculate background for EC and SAR • Limited site characterization and budget
Case Study 1 Area of Potential Impact Background locations Well Head • Background locations • Representative of un-impacted soil • Collected near area of potential salinity impact • Used to identify a soil rating category • Upper limit of the soil rating category becomes the guideline
Case Study 1 Histograms not very useful in this case
Case Study 1 • Boxplots of background data vs. Area of Potential Impact (AOPI) Data • EC and SAR data distributions are very similar in background vs. AOPI • IQR is smaller in the AOPI since there is more data • Medians very similar • No identified “potential outliers” • Indicates that any elevated EC/SAR located in the AOPI may be natural and not-site related • All depths included
Case Study 1 • Calculation of Background • Sub-divided into different depths intervals • USEPA UPL method could not be performed: • Data not quite normal • Not enough data (8-10 min)
Case Study 1 • Calculation of Background • Sub-divided into different depths intervals • USEPA UPL method could not be performed: • Data not quite normal • Not enough data (8-10 min)
Case Study 1 • Within each depth interval, background is calculated and used to identify a soil rating category • Upper limit of the soil rating category becomes the guideline for that depth interval
Case Study 1 Different excavation area depending on background calculation method Excavation required based on BC, MOE, AEW, USEPA and “other” method Additional excavation required based on AEW and USEPA method
Case Study 2 • Former fertilizer facility in Manitoba • Fertilizer contaminants in soil and groundwater • Native soil profile: inter-layered silt and clay to 4.4 mbg, fractured bedrock below • Groundwater in overburden: 1 mbg • Depth to groundwater in bedrock: 11 to 14 mbg • Groundwater ingestion pathway a concern • Water wells within 500 m of the site • No aquitard between the impacted zone within overburden and the underlying bedrock aquifer
Case Study 2 • Calculation of background nitrate in groundwater required • Possible non-site related anthropogenic sources from residential septic tanks located upgradient of site • Suspect that background nitrate is greater than the CCME drinking water standard of 10 mg/L • Required a soil clean-up criteria to delineate site-related nitrate impacts • Calculated based on background groundwater criteria • Complications • Choosing appropriate background locations • Potential seasonality of groundwater concentrations • Difficulty in determining groundwater flow direction
Case Study 2 • Background locations in blue • Representative of un-impacted soils • Takes into account potential, non-site related sources of nitrate • Collected upgradient from site 500 m radius line Downgradient locations in green Site
Case Study 2 No significant seasonal fluctuations Site data has different distribution than background data
Case Study 2 • All data, fall and spring distributions are very similar to each other in both background and site data • Negligible seasonal variability • Background data distributions different than Site data distributions • IQR is larger in the site data • More identified “potential outliers” on site • Indicates that elevated nitrate concentrations onsite are site-related (above background)
Case Study 2 • Background calculation method comparison • Since no significant seasonal fluctuations, only calculated for all seasons • All site-specific backgrounds are above CCME drinking water standard of 10 mg/L
Case Study 2 • Partitioning calculation for site-specific soil criteria • Using standard CCME parameters
Case Study 2 Different excavation area depending on background calculation method
Conclusions • BC MOE and ON MOE methods are very similar • Methods including outlier analysis yield different results than those that don’t • Take care in the identification and treatment of outliers • Other methods (e.g, average + 3 x stdev) often yield background values that are above the data maximum • Use at your own discretion