Download
1 / 10
100 likes | 208 Vues
This report studies sales (consumption) of Lithium Ion Battery Cells in Global market, especially in USA, China, Europe, Japan, and , focuses on top players in these regions/countries, with sales, price, revenue and market share for each player in these regions.

E N D
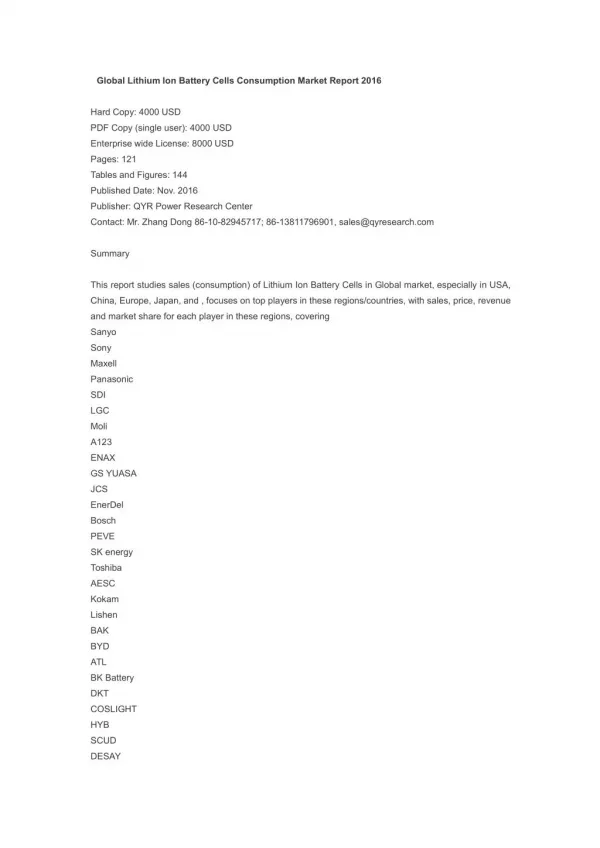
Global Lithium Ion Battery Cells Consumption Market Report 2016 Hard Copy: 4000 USD PDF Copy (single user): 4000 USD Enterprise wide License: 8000 USD Pages: 121 Tables and Figures: 144 Published Date: Nov. 2016 Publisher: QYR Power Research Center Contact: Mr. Zhang Dong 86-10-82945717; 86-13811796901, sales@qyresearch.com Summary This report studies sales (consumption) of Lithium Ion Battery Cells in Global market, especially in USA, China, Europe, Japan, and , focuses on top players in these regions/countries, with sales, price, revenue and market share for each player in these regions, covering Sanyo Sony Maxell Panasonic SDI LGC Moli A123 ENAX GS YUASA JCS EnerDel Bosch PEVE SK energy Toshiba AESC Kokam Lishen BAK BYD ATL BK Battery DKT COSLIGHT HYB SCUD DESAY
EVE SUNWODA Guoxuan High-tech Changhong Batteries Fengfan New Energy SAPT Fenghua LIB China Aviation Lithium Battery Market Segment by Regions, this report splits Global into several key Regions, with sales (consumption), revenue, market share and growth rate of Lithium Ion Battery Cells in these regions, from 2011 to 2021 (forecast), like USA China Europe Japan Split by product Types, with Sales, Revenue, Price and Gross Margin, market share and growth rate of each type, can be divided into Lithium Cobalt Oxide Lithium Manganate Ferrous Phosphate Lithium Split by applications, this report focuses on sales, market share and growth rate of Lithium Ion Battery Cells in each application, can be divided into Vehicle Electric Tool Small appliances Other Table of Contents Global Lithium Ion Battery Cells Sales Market Report 2016 1 Lithium Ion Battery Cells Overview 1.1 Product Overview and Scope of Lithium Ion Battery Cells 1.2 Classification of Lithium Ion Battery Cells 1.2.1 Lithium Cobalt Oxide
1.2.2 Lithium Manganate 1.2.3 Ferrous Phosphate Lithium 1.3 Applications of Lithium Ion Battery Cells 1.3.1 Vehicle 1.3.2 Electric Tool 1.3.3 Small appliances 1.3.4 Other 1.3.5 1.4 Lithium Ion Battery Cells Market by Regions 1.4.1 USA Status and Prospect (2011-2021) 1.4.2 China Status and Prospect (2011-2021) 1.4.3 Europe Status and Prospect (2011-2021) 1.4.4 Japan Status and Prospect (2011-2021) 1.4.5 聽 Status and Prospect (2011-2021) 1.4.6 聽 Status and Prospect (2011-2021) 1.5 Global Market Size (Value and Volume) of Lithium Ion Battery Cells (2011-2021) 1.5.1 Global Lithium Ion Battery Cells Sales and Growth Rate (2011-2021) 1.5.2 Global Lithium Ion Battery Cells Revenue and Growth Rate (2011-2021) 2 Global Lithium Ion Battery Cells Competition by Manufacturers, Type and Application 2.1 Global Lithium Ion Battery Cells Market Competition by Manufacturers 2.1.1 Global Lithium Ion Battery Cells Sales and Market Share of Key Manufacturers (2011-2016) 2.1.2 Global Lithium Ion Battery Cells Revenue and Share by Manufacturers (2011-2016) 2.2 Global Lithium Ion Battery Cells (Volume and Value) by Type 2.2.1 Global Lithium Ion Battery Cells Sales and Market Share by Type (2011-2016) 2.2.2 Global Lithium Ion Battery Cells Revenue and Market Share by Type (2011-2016) 2.3 Global Lithium Ion Battery Cells (Volume and Value) by Regions 2.3.1 Global Lithium Ion Battery Cells Sales and Market Share by Regions (2011-2016) 2.3.2 Global Lithium Ion Battery Cells Revenue and Market Share by Regions (2011-2016) 2.4 Global Lithium Ion Battery Cells (Volume) by Application 3 USA Lithium Ion Battery Cells (Volume, Value and Sales Price) 3.1 USA Lithium Ion Battery Cells Sales and Value (2011-2016) 3.1.1 USA Lithium Ion Battery Cells Sales and Growth Rate (2011-2016) 3.1.2 USA Lithium Ion Battery Cells Revenue and Growth Rate (2011-2016) 3.1.3 USA Lithium Ion Battery Cells Sales Price Trend (2011-2016) 3.2 USA Lithium Ion Battery Cells Sales and Market Share by Manufacturers 3.3 USA Lithium Ion Battery Cells Sales and Market Share by Type 3.4 USA Lithium Ion Battery Cells Sales and Market Share by Applications 4 China Lithium Ion Battery Cells (Volume, Value and Sales Price) 4.1 China Lithium Ion Battery Cells Sales and Value (2011-2016) 4.1.1 China Lithium Ion Battery Cells Sales and Growth Rate (2011-2016) 4.1.2 China Lithium Ion Battery Cells Revenue and Growth Rate (2011-2016) 4.1.3 China Lithium Ion Battery Cells Sales Price Trend (2011-2016) 4.2 China Lithium Ion Battery Cells Sales and Market Share by Manufacturers 4.3 China Lithium Ion Battery Cells Sales and Market Share by Type
4.4 China Lithium Ion Battery Cells Sales and Market Share by Applications 5 Europe Lithium Ion Battery Cells (Volume, Value and Sales Price) 5.1 Europe Lithium Ion Battery Cells Sales and Value (2011-2016) 5.1.1 Europe Lithium Ion Battery Cells Sales and Growth Rate (2011-2016) 5.1.2 Europe Lithium Ion Battery Cells Revenue and Growth Rate (2011-2016) 5.1.3 Europe Lithium Ion Battery Cells Sales Price Trend (2011-2016) 5.2 Europe Lithium Ion Battery Cells Sales and Market Share by Manufacturers 5.3 Europe Lithium Ion Battery Cells Sales and Market Share by Type 5.4 Europe Lithium Ion Battery Cells Sales and Market Share by Applications 6 Japan Lithium Ion Battery Cells (Volume, Value and Sales Price) 6.1 Japan Lithium Ion Battery Cells Sales and Value (2011-2016) 6.1.1 Japan Lithium Ion Battery Cells Sales and Growth Rate (2011-2016) 6.1.2 Japan Lithium Ion Battery Cells Revenue and Growth Rate (2011-2016) 6.1.3 Japan Lithium Ion Battery Cells Sales Price Trend (2011-2016) 6.2 Japan Lithium Ion Battery Cells Sales and Market Share by Manufacturers 6.3 Japan Lithium Ion Battery Cells Sales and Market Share by Type 6.4 Japan Lithium Ion Battery Cells Sales and Market Share by Applications 7 Global Lithium Ion Battery Cells Manufacturers Analysis 7.1 Sanyo 7.1.1 Company Basic Information, Manufacturing Base and Competitors 7.1.2 Lithium Ion Battery Cells Product Types, Application and Specification 7.1.2.1 Lithium Cobalt Oxide 7.1.2.2 Lithium Manganate 7.1.3 Sanyo Lithium Ion Battery Cells Sales, Revenue, Price and Gross Margin (2011-2016) 7.1.4 Main Business/Business Overview 7.2 Sony 7.2.1 Company Basic Information, Manufacturing Base and Competitors 7.2.2 Lithium Ion Battery Cells Product Types, Application and Specification 7.2.2.1 Lithium Cobalt Oxide 7.2.2.2 Lithium Manganate 7.2.3 Sony Lithium Ion Battery Cells Sales, Revenue, Price and Gross Margin (2011-2016) 7.2.4 Main Business/Business Overview 7.3 Maxell 7.3.1 Company Basic Information, Manufacturing Base and Competitors 7.3.2 Lithium Ion Battery Cells Product Types, Application and Specification 7.3.2.1 Lithium Cobalt Oxide 7.3.2.2 Lithium Manganate 7.3.3 Maxell Lithium Ion Battery Cells Sales, Revenue, Price and Gross Margin (2011-2016) 7.3.4 Main Business/Business Overview 7.4 Panasonic 7.4.1 Company Basic Information, Manufacturing Base and Competitors 7.4.2 Lithium Ion Battery Cells Product Types, Application and Specification 7.4.2.1 Lithium Cobalt Oxide 7.4.2.2 Lithium Manganate
7.4.3 Panasonic Lithium Ion Battery Cells Sales, Revenue, Price and Gross Margin (2011-2016) 7.4.4 Main Business/Business Overview 7.5 SDI 7.5.1 Company Basic Information, Manufacturing Base and Competitors 7.5.2 Lithium Ion Battery Cells Product Types, Application and Specification 7.5.2.1 Lithium Cobalt Oxide 7.5.2.2 Lithium Manganate 7.5.3 SDI Lithium Ion Battery Cells Sales, Revenue, Price and Gross Margin (2011-2016) 7.5.4 Main Business/Business Overview 7.6 LGC 7.6.1 Company Basic Information, Manufacturing Base and Competitors 7.6.2 Lithium Ion Battery Cells Product Types, Application and Specification 7.6.2.1 Lithium Cobalt Oxide 7.6.2.2 Lithium Manganate 7.6.3 LGC Lithium Ion Battery Cells Sales, Revenue, Price and Gross Margin (2011-2016) 7.6.4 Main Business/Business Overview 7.7 Moli 7.7.1 Company Basic Information, Manufacturing Base and Competitors 7.7.2 Lithium Ion Battery Cells Product Types, Application and Specification 7.7.2.1 Lithium Cobalt Oxide 7.7.2.2 Lithium Manganate 7.7.3 Moli Lithium Ion Battery Cells Sales, Revenue, Price and Gross Margin (2011-2016) 7.7.4 Main Business/Business Overview 7.8 A123 7.8.1 Company Basic Information, Manufacturing Base and Competitors 7.8.2 Lithium Ion Battery Cells Product Types, Application and Specification 7.8.2.1 Lithium Cobalt Oxide 7.8.2.2 Lithium Manganate 7.8.3 Lithium Ion Battery Cells Sales, Revenue, Price and Gross Margin A123 (2011-2016) 7.9 ENAX 7.9.1 Company Basic Information, Manufacturing Base and Competitors 7.9.2 Lithium Ion Battery Cells Product Types, Application and Specification 7.9.2.1 Lithium Cobalt Oxide 7.9.2.2 Lithium Manganate 7.9.3 ENAX Lithium Ion Battery Cells Sales, Revenue, Price and Gross Margin (2011-2016) 7.9.4 Main Business/Business Overview 7.10 GS YUASA 7.10.1 Company Basic Information, Manufacturing Base and Competitors 7.10.2 Lithium Ion Battery Cells Product Types, Application and Specification 7.10.2.1 Lithium Cobalt Oxide 7.10.2.2 Lithium Manganate 7.10.3 GS YUASA Lithium Ion Battery Cells Sales, Revenue, Price and Gross Margin (2011-2016) 10.8.4 Main Business/Business Overview 7.11 JCS
7.12 EnerDel 7.13 Bosch 7.14 PEVE 7.15 SK energy 7.16 Toshiba 7.17 AESC 7.18 Kokam 7.19 Lishen 7.20 BAK 7.21 BYD 7.22 ATL 7.23 BK Battery 7.24 DKT 7.25 COSLIGHT 7.26 HYB 7.27 SCUD 7.28 DESAY 7.29 EVE 7.30 SUNWODA 8 Lithium Ion Battery Cells Manufacturing Cost Analysis 8.1 Lithium Ion Battery Cells Key Raw Materials Analysis 8.1.1 Key Raw Materials 8.1.2 Price Trend of Key Raw Materials 8.1.3 Key Suppliers of Raw Materials 8.1.4 Market Concentration Rate of Raw Materials 8.2 Proportion of Manufacturing Cost Structure 8.2.1 Raw Materials 8.2.2 Labor Cost 8.2.3 Manufacturing Expenses 8.3 Manufacturing Process Analysis of Lithium Ion Battery Cells 9 Industrial Chain, Sourcing Strategy and Downstream Buyers 9.1 Lithium Ion Battery Cells Industrial Chain Analysis 9.2 Upstream Raw Materials Sourcing 9.3 Raw Materials Sources of Lithium Ion Battery Cells Major Manufacturers in 2015 9.4 Downstream Buyers 10 Marketing Strategy Analysis, Distributors/Traders 10.1 Marketing Channel 10.1.1 Direct Marketing 10.1.2 Indirect Marketing 10.1.3 Marketing Channel Development Trend 10.2 Market Positioning 10.2.1 Pricing Strategy 10.2.2 Brand Strategy 10.2.3 Target Client
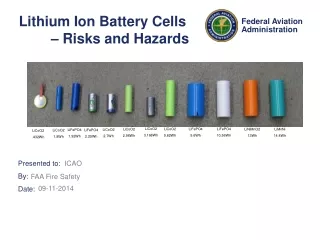
10.3 Distributors/Traders List 11 Market Effect Factors Analysis 11.1 Technology Progress/Risk 11.1.1 Substitutes Threat 11.1.2 Technology Progress in Related Industry 11.2 Consumer Needs/Customer Preference Change 11.3 Economic/Political Environmental Change 12 Global Lithium Ion Battery Cells Market Forecast (2016-2021) 12.1 Global Lithium Ion Battery Cells Sales, Revenue Forecast (2016-2021) 12.2 Global Lithium Ion Battery Cells Sales Forecast by Regions (2016-2021) 12.3 Global Lithium Ion Battery Cells Sales Forecast by Type (2016-2021) 12.4 Global Lithium Ion Battery Cells Sales Forecast by Application (2016-2021) 13 Conclusion 14 Appendix Disclosure Section Research Methodology Data Source China Disclaimer List of Tables and Figures Figure Picture of Lithium Ion Battery Cells Table Classification of Lithium Ion Battery Cells Figure Global Sales Market Share of Lithium Ion Battery Cells by Types in 2015 Figure Lithium Cobalt Oxide Picture Figure Lithium Manganate Picture Figure Ferrous Phosphate Lithium Picture Table Applications of Lithium Ion Battery Cells Figure Global Sales Market Share of Lithium Ion Battery Cells by Applications in 2015 Figure Vehicle Examples Figure Electric Tool Examples Figure Small appliances Examples Figure Other Examples Figure 聽 Examples Figure USA Lithium Ion Battery Cells Revenue and Growth Rate (2011-2021) Figure China Lithium Ion Battery Cells Revenue and Growth Rate (2011-2021) Figure Europe Lithium Ion Battery Cells Revenue and Growth Rate (2011-2021) Figure Japan Lithium Ion Battery Cells Revenue and Growth Rate (2011-2021) Figure Lithium Ion Battery Cells Revenue and Growth Rate (2011-2021) Figure Lithium Ion Battery Cells Revenue and Growth Rate (2011-2021) Figure Global Lithium Ion Battery Cells Sales and Growth Rate (2011-2021) Figure Global Lithium Ion Battery Cells Revenue and Growth Rate (2011-2021) Table Global Lithium Ion Battery Cells Sales of Key Manufacturers (2011-2016) Table Global Lithium Ion Battery Cells Sales Share by Manufacturers (2011-2016)
Figure 2015 Lithium Ion Battery Cells Sales Share by Manufacturers Figure 2016 Lithium Ion Battery Cells Sales Share by Manufacturers Table Global Lithium Ion Battery Cells Revenue by Manufacturers (2011-2016) Table Global Lithium Ion Battery Cells Revenue Share by Manufacturers (2011-2016) Table 2015 Global Lithium Ion Battery Cells Revenue Share by Manufacturers Table 2016 Global Lithium Ion Battery Cells Revenue Share by Manufacturers Table Global Lithium Ion Battery Cells Sales and Market Share by Type (2011-2016) Table Global Lithium Ion Battery Cells Sales Share by Type (2011-2016) Figure Sales Market Share of Lithium Ion Battery Cells by Type (2011-2016) Figure Global Lithium Ion Battery Cells Sales Growth Rate by Type (2011-2016) Table Global Lithium Ion Battery Cells Revenue and Market Share by Type (2011-2016) Table Global Lithium Ion Battery Cells Revenue Share by Type (2011-2016) Figure Revenue Market Share of Lithium Ion Battery Cells by Type (2011-2016) Figure Global Lithium Ion Battery Cells Revenue Growth Rate by Type (2011-2016) Table Global Lithium Ion Battery Cells Sales and Market Share by Regions (2011-2016) Table Global Lithium Ion Battery Cells Sales Share by Regions (2011-2016) Figure Sales Market Share of Lithium Ion Battery Cells by Regions (2011-2016) Figure Global Lithium Ion Battery Cells Sales Growth Rate by Regions (2011-2016) Table Global Lithium Ion Battery Cells Revenue and Market Share by Regions (2011-2016) Table Global Lithium Ion Battery Cells Revenue Share by Regions (2011-2016) Figure Revenue Market Share of Lithium Ion Battery Cells by Regions (2011-2016) Figure Global Lithium Ion Battery Cells Revenue Growth Rate by Regions (2011-2016) Table Global Lithium Ion Battery Cells Sales and Market Share by Application (2011-2016) Table Global Lithium Ion Battery Cells Sales Share by Application (2011-2016) Figure Sales Market Share of Lithium Ion Battery Cells by Application (2011-2016) Figure Global Lithium Ion Battery Cells Sales Growth Rate by Application (2011-2016) Figure USA Lithium Ion Battery Cells Sales and Growth Rate (2011-2016) Figure USA Lithium Ion Battery Cells Revenue and Growth Rate (2011-2016) Figure USA Lithium Ion Battery Cells Sales Price Trend (2011-2016) Table USA Lithium Ion Battery Cells Sales by Manufacturers (2011-2016) Table USA Lithium Ion Battery Cells Market Share by Manufacturers (2011-2016) Table USA Lithium Ion Battery Cells Sales by Type (2011-2016) Table USA Lithium Ion Battery Cells Market Share by Type (2011-2016) Table USA Lithium Ion Battery Cells Sales by Applications (2011-2016) Table USA Lithium Ion Battery Cells Market Share by Applications (2011-2016) Figure China Lithium Ion Battery Cells Sales and Growth Rate (2011-2016) Figure China Lithium Ion Battery Cells Revenue and Growth Rate (2011-2016) Figure China Lithium Ion Battery Cells Sales Price Trend (2011-2016) Table China Lithium Ion Battery Cells Sales by Manufacturers (2011-2016) Table China Lithium Ion Battery Cells Market Share by Manufacturers (2011-2016) Table China Lithium Ion Battery Cells Sales by Type (2011-2016) Table China Lithium Ion Battery Cells Market Share by Type (2011-2016) Table China Lithium Ion Battery Cells Sales by Applications (2011-2016) Table China Lithium Ion Battery Cells Market Share by Applications (2011-2016)
Figure Europe Lithium Ion Battery Cells Sales and Growth Rate (2011-2016) Figure Europe Lithium Ion Battery Cells Revenue and Growth Rate (2011-2016) Figure Europe Lithium Ion Battery Cells Sales Price Trend (2011-2016) Table Europe Lithium Ion Battery Cells Sales by Manufacturers (2011-2016) Table Europe Lithium Ion Battery Cells Market Share by Manufacturers (2011-2016) Table Europe Lithium Ion Battery Cells Sales by Type (2011-2016) Table Europe Lithium Ion Battery Cells Market Share by Type (2011-2016) Table Europe Lithium Ion Battery Cells Sales by Applications (2011-2016) Table Europe Lithium Ion Battery Cells Market Share by Applications (2011-2016) Figure Japan Lithium Ion Battery Cells Sales and Growth Rate (2011-2016) Figure Japan Lithium Ion Battery Cells Revenue and Growth Rate (2011-2016) Figure Japan Lithium Ion Battery Cells Sales Price Trend (2011-2016) Table Japan Lithium Ion Battery Cells Sales by Manufacturers (2011-2016) Table Japan Lithium Ion Battery Cells Market Share by Manufacturers (2011-2016) Table Japan Lithium Ion Battery Cells Sales by Type (2011-2016) Table Japan Lithium Ion Battery Cells Market Share by Type (2011-2016) Table Japan Lithium Ion Battery Cells Sales by Applications (2011-2016) Table Japan Lithium Ion Battery Cells Market Share by Applications (2011-2016) Figure Lithium Ion Battery Cells Sales and Growth Rate (2011-2016) Figure Lithium Ion Battery Cells Revenue and Growth Rate (2011-2016) Figure Lithium Ion Battery Cells Sales Price Trend (2011-2016) Table Lithium Ion Battery Cells Sales by Manufacturers (2011-2016) Table Lithium Ion Battery Cells Market Share by Manufacturers (2011-2016) Table Lithium Ion Battery Cells Sales by Type (2011-2016) Table Lithium Ion Battery Cells Market Share by Type (2011-2016) Table Lithium Ion Battery Cells Sales by Applications (2011-2016) Table Lithium Ion Battery Cells Market Share by Applications (2011-2016) Figure Lithium Ion Battery Cells Sales and Growth Rate (2011-2016) Figure Lithium Ion Battery Cells Revenue and Growth Rate (2011-2016) Figure Lithium Ion Battery Cells Sales Price Trend (2011-2016) Table Lithium Ion Battery Cells Sales by Manufacturers (2011-2016) Table Lithium Ion Battery Cells Market Share by Manufacturers (2011-2016) TableLithium Ion Battery Cells Sales by Type (2011-2016) Table Lithium Ion Battery Cells Market Share by Type (2011-2016) Table Lithium Ion Battery Cells Sales by Applications (2011-2016) Table Lithium Ion Battery Cells Market Share by Applications (2011-2016) Table Sanyo Basic Information List Table Sanyo Lithium Ion Battery Cells Sales, Revenue, Price and Gross Margin (2011-2016) Figure Sanyo Lithium Ion Battery Cells Global Market Share (2011-2016) Table Sony Basic Information List Table Sony Lithium Ion Battery Cells Sales, Revenue, Price and Gross Margin (2011-2016) Figure Sony Lithium Ion Battery Cells Global Market Share (2011-2016) Table Maxell Basic Information List Table Maxell Lithium Ion Battery Cells Sales, Revenue, Price and Gross Margin (2011-2016)
Figure Maxell Lithium Ion Battery Cells Global Market Share (2011-2016) Table Panasonic Basic Information List Table Panasonic Lithium Ion Battery Cells Sales, Revenue, Price and Gross Margin (2011-2016) Figure Panasonic Lithium Ion Battery Cells Global Market Share (2011-2016) Table SDI Basic Information List Table SDI Lithium Ion Battery Cells Sales, Revenue, Price and Gross Margin (2011-2016) Figure SDI Lithium Ion Battery Cells Global Market Share (2011-2016) Table LGC Basic Information List Table LGC Lithium Ion Battery Cells Sales, Revenue, Price and Gross Margin (2011-2016) Figure LGC Lithium Ion Battery Cells Global Market Share (2011-2016) Table Moli Basic Information List Table Moli Lithium Ion Battery Cells Sales, Revenue, Price and Gross Margin (2011-2016) Figure Moli Lithium Ion Battery Cells Global Market Share (2011-2016) Table A123 Basic Information List Table Lithium Ion Battery Cells Sales, Revenue, Price and Gross Margin A123 (2011-2016) Table ENAX Basic Information List Table ENAX Lithium Ion Battery Cells Sales, Revenue, Price and Gross Margin (2011-2016) Figure ENAX Lithium Ion Battery Cells Global Market Share (2011-2016) Table GS YUASA Basic Information List Table GS YUASA Lithium Ion Battery Cells Sales, Revenue, Price and Gross Margin (2011-2016) Figure GS YUASA Lithium Ion Battery Cells Global Market Share (2011-2016) Table Production Base and Market Concentration Rate of Raw Material Figure Price Trend of Key Raw Materials Table Key Suppliers of Raw Materials Figure Manufacturing Cost Structure of Lithium Ion Battery Cells Figure Manufacturing Process Analysis of Lithium Ion Battery Cells Figure Lithium Ion Battery Cells Industrial Chain Analysis Table Raw Materials Sources of Lithium Ion Battery Cells Major Manufacturers in 2015 Table Major Buyers of Lithium Ion Battery Cells Table Distributors/Traders List Figure Global Lithium Ion Battery Cells Sales and Growth Rate Forecast (2016-2021) Figure Global Lithium Ion Battery Cells Revenue and Growth Rate Forecast (2016-2021) Table Global Lithium Ion Battery Cells Sales Forecast by Regions (2016-2021) Table Global Lithium Ion Battery Cells Sales Forecast by Type (2016-2021)