Download
1 / 40
400 likes | 418 Vues
Gain insights into the current labor market conditions and future predictions with DEED's regional analysts. Access reports, attend presentations, and get original research to answer tough questions.

E N D
Rachel Hillman Regional Labor Market Analyst MN Dept. of Employment & Economic Development St. Paul WorkForce Center The Changing Labor Market: Current Conditions and Future Predictions
About DEED’s regional analysts • Collaborate with regional stakeholders on new research • Extend access to DEED reports and statistics • Conduct presentations and training onregional economy and labor market • Original research and analysis intended to answer “the tough questions” • Five regional analystsstationed across the state
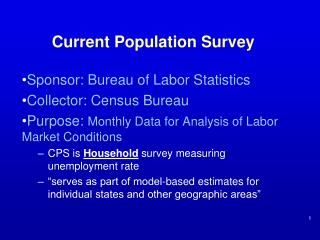
What is labor market information? • Labor market information is any information about people, work and the job market: • Geographic area – where people work • Industry or business – who people work for • Occupation – what people do • Wages – how much they earn
Firsthand knowledge versus LMI Labor market information adds context to what we know from talking with people and what we read in the news… • Economy is all about jobs St. Paul Pioneer Press – February 19, 2008 • Job losses pile up St. Paul Pioneer Press – January 16, 2008 • Consumers’ winter blues put a chill on economy Star Tribune – January 11, 2008 • More manufacturers going green Star Tribune – December 28, 2007
Trends at a regional scale beyond employment and the labor force • Gaining 1 million people in 30 years • Rapid population growth on the developing edge • Continued spread of suburban and exurban development • Population churn brings diversity and diversification of the region • Traffic congestion not getting better • Gas prices not getting better • Finite supply of land = rising land prices • Redevelopment and intensification of land use in the core
Twin Cities area labor shed (or where workers in the Twin Cities area live)
Minnesota’s year end review • Over the year Minnesota gained 6,200 jobs in December 2007. REVISED • This was below the nation’s growth rate of 0.9%. • In terms of over-the-year job gains by sector, Minnesota is ahead of nationwide job growth in the education & health services and financial activities. • Manufacturing makes up a lower percent of employment than 6 years ago. • The health care and financial services sectors are growing. • Minnesota’s unemployment rate was 4.0% in 2006 with 117,000 unemployed, but that doesn’t count “discouraged” or “marginally attached” workers. In 2007, monthly unemployment rates have been on the rise, reaching 4.7% in December. • Labor force participation rate is around 72.6%. • Number of job opportunities has remained consistent, but some occupations are in demand. Source: MN Dept of Employment & Economic Development
Annual unemployment rates: Twin Cities, Minnesota, and U.S. *Monthly rate not seasonally adjusted Source: MN Dept of Employment & Economic Development
Alternative national unemployment rate calculations, January 2008 • U-3 – Total unemployment, as a percent of the civilian labor force: 4.9%*This is the official unemployment rate.* • U-4 – Total unemployed + discouraged workers, as a % of the civilian labor force + discouraged workers: 5.2% • U-5 – Total unemployed + discouraged workers + all other marginally attached workers, as a % of the civilian labor force + all marginally attached workers: 6.0% • U-6 – Total unemployed + all marginally attached workers + total employed part time for economic reasons, as a % of the civilian labor force + all marginally attached workers: 9.0% Source: Bureau of Labor Statistics, Current Population Survey
Twin Cities statistics in unemployment insurance applicants, 2007 Age of Unemployment Insurance Applicants, 2007 Educational Attainment of Unemployment Insurance Applicants, 2007 Source: MN Dept of Employment & Economic Development
Recent employment trends in the Twin Cities Employment Change December 2005 to December 2007 • Manufacturing -4,050 (-1.9%) • Medical equipment and supplies mfg. +1,410 (3.7%) • Specialty Trade Construction -7,140 (-12.7%) • Professional and Business Services +8,290 (3.2%) (includes legal services, architectural and engineering services, computer systems designs, management of companies, administrative and support) • Health Care and Social Assistance +20,410 (10.3%) All industries = +13,710 (0.8%)
Employment changes since 2000 • Manufacturing -36,500 (-15.4%) • Machinery mfg. -8,860 (-28.9%) • Navigational, measuring, electromedical and control instrument mfg. +2,100 (9.9%) • Medical equipment and supplies mfg. +4,151 (37.4%) • Professional and Business Services -50 (0.0%) • Health Care and Social Assistance +53,930 (32.8%) • Leisure and Hospitality +19,000 (13.4%) (includes arts, entertainment, accommodation and food services) • Finance and Insurance +4,110 (3.9%) All industries = +32,362 (1.8%)
Minnesota job vacancy survey • In 2000, Minnesota’s Labor Market Information (LMI) Office began tracking the number of job vacancies currently open for hire. • Job vacancy statistics are produced twice a year for the second quarter (April to June) and fourth quarter (October to December). • Describe job vacancies in terms of: • Education and experience • Wages • Part-time/full-time • Temporary/seasonal or permanent
Vacancies are down but the “nature” of vacancies has changed as well. Source: MN Dept of Employment & Economic Development
Where are the jobs now? • 35,150 job openings in the Twin Cities job market during 2nd Quarter 2007 • 2.2% job vacancy rate • 5.4 job vacancies for every 10 unemployed people • Hiring demand is highest in some high-skill occupations: • Health care practitioners and technical • Management • Health care support • Computer and mathematical • Business and financial operations
Job vacancies by industry sector Source: MN Dept of Employment & Economic Development
Occupations with the most openings in the Twin Cities Source: MN Dept of Employment & Economic Development
Median starting wage rates of job vacancies Median Wage of all openings = $13.00 Source: MN Dept of Employment & Economic Development
Skill levels required for job openings in the Twin Cities Note: Second quarter data presented. Source: MN Dept of Employment & Economic Development, Minnesota Job Vacancy Survey
Occupations in demand • Sort jobs by wages, growth rates or education/training requirements • Job titles link to educational programs in Minnesota for these occupations • Job codes link to I*SEEK career information for these occupations
Minnesota’s industrial and occupational employment projections • Every states’ Labor Market Information (LMI) Office is charged with producing employment projections on an industry and occupational level. • Projections are estimated over a 10 year period every two years for the nation, state and regions. • Projections are largely based on past trends. We cannot predict: • Recessions, depressions, energy crises, etc. • Wars • Technology change • New business processes • Legislation
Where will the jobs be? • In the Twin Cities region, we project that 225,000 new jobs will be created between 2004 and 2014 – this is a 13% growth rate. • Another 402,000 new work force entrants will be needed to replace workers who have retired or otherwise left their position. • More than one-fourth of the new jobs will be either an education or health related job. • Post-secondary education will be required for 15 of the top 20 fastest growing jobs in the Twin Cities. • 16 of the top 20 occupations have average wages of greater than $20/hour. Source: MN Dept of Employment & Economic Development
Health care will add the most new jobs in the Twin Cities. Source: MN Dept of Employment & Economic Development
Projected employment growth by detailed industry Source: MN Dept of Employment & Economic Development
Network Systems and Data Communication Analysts Home Health Aides Personal and Home Care Aides Physician Assistants Computer Software Engineers, Applications Computer Software Engineers, Systems Software Biomedical Engineers Athletic Trainers Hazardous Materials Removal Workers Medical Assistants Dental Hygienists Dental Assistants Community and Social Service Specialists Medical Scientists Database Administrators Biochemists and Biophysicists Environmental Engineers Network and Computer Systems Administrators Vocational Education Teachers, Postsecondary Social and Human Services Assistants Fastest growing occupations in the Twin Cities, 2004 to 2014 Source: MN Dept of Employment & Economic Development
Retail Salespersons Registered Nurses Combined Food Preparation and Serving Workers, Fast Food Workers Personal and Home Care Aides Computer Software Engineers, Applications Customer Service Representatives Home Health Aides Janitors and Cleaners Accountants and Auditors Waiters and Waitresses Office Clerks, General Receptionists and Information Clerks Sales Representatives, Wholesale and Manufacturing Executive Secretaries and Administrative Assistants Computer Software Engineers, Systems Software Truck Drivers, Heavy and Tractor-Trailer Social and Human Services Assistants Computer Systems Analysts Network Systems and Data Communications Analysts Carpenters Occupations adding the most jobs in the Twin Cities, 2004 to 2014 Source: MN Dept of Employment & Economic Development
Skills areas projected to be most utilized by future occupations: Reading Comprehension Active Listening Speaking Writing Active Learning Coordination Monitoring Instructing Critical Thinking Knowledge areas projected to be most utilized by future occupations: Customer Service Mathematics Clerical Education/training English Sales/marketing Psychology Computers/electronics Administration/management Skill and knowledge areas for “in demand” jobs
Almost half of respondents said the availability of qualified applicants was a concern, but even more (77%) said they were concerned about the cost of employee benefits. 1 in 12 were concerned about the number of pending employee retirements Hiring difficulties were more pronounced in healthcare and manufacturing. Increased hours for current employees Used temporary agency employees Shifted work to other company locations Employers generally saw hiring problems as an issue of quality, not quantity. About one-third indicated that they have trouble with employee retention and turnover. Competition from other local firms Competition from metropolitan area firms Retirements 27% are concerned about the skill levels of their current employees. 9 out of 10 employers provide some type of on-the-job training. 73% said they need to offer employee training because it is a business necessity. Skills shortage…now! Source: MN Dept of Employment & Economic Development, South Central Employer Survey Results, July 2006.
Perceived Deficiencies of Job Seekers Unstable work history (64%) Not enough work experience (56%) Poor technical skills – as demonstrated in the selection process (35%) Too little formal education (26%) Poor language or communication skills in an interview (20%) Poor reading or comprehension skills – as demonstrated in the selection process (16%) Poor math skills – as demonstrated in the selection process (4%) Perceived Deficiencies of Current Workforce by Employers Concerned with Employee Skills Inadequate basic employability skills, e.g. attendance, timeliness, work ethic (48%) Inadequate problem-solving skills (30%) Inadequate reading/writing or communication skills (30%) Inability to work in a team environment (27%) Inadequate math skills (15%) Lack of degree or vocational technical training (13%) Perceived deficiencies Source: MN Dept of Employment & Economic Development, South Central Employer Survey Results, July 2006.
Return of labor shortage worries • Job growth is projected to be steady overall, but very high in some industries like health care • An increasingly tight labor market • The existing workforce is aging • Labor force growth is slowing and will start shrinking • While renewed economic growth will tighten the labor market, demographics may play an even bigger role.
Twin Cities population forecast compared to United States: growth per decade, 1950-2030 Source: U.S. Census Bureau, Metropolitan Council estimates
20 Year projected change in Twin Cities population by age group (2005-2025) Source: MN State Demographic Center
Immigration is a key growth component 70,000 60,000 50,000 Twin Cities residents new to the US Racial minority 40,000 30,000 20,000 White 10,000 0 1955-1960 1965-1970 1975-1980 1985-1990 1995-2000 Source: U.S. Census Bureau, Metropolitan Council estimates
Minnesota’s nonwhite and Latino populations are projected to grow substantially faster than the white population By 2030, 1 in every 5Minnesotans will be Hispanic or of color Source: MN State Demographic Center “Only 10 percent of baby boomers in the Metro area are from a minority group, but minorities comprise one-quarter of the next generation of workers.” Source: Mind the Gap: Disparities and Competitiveness in the Twin Cities, Brookings Foundation Metropolitan Policy, October 2005. In 2005, 6.3 percent of Minnesota's total population were foreign born. In 2005, the foreign born represented 6.8 percent of Minnesota's civilian employed workforce. The number of foreign-born workers in Minnesota grew by 37.9 percent between 2000 and 2005. Source: Migration Policy Institute In 2005, 3.7 percent of employed workers in Minnesota were limited English proficient. Source: Migration Policy Institute A more diverse population and workforce
Future labor force growth in the Twin Cities Source: MN State Demographic Center
What does this mean? • We expect 225,000 new jobs to be created between 2004 and 2014 in the Twin Cities. • Labor force projections estimate 104,000 new workforce entrants between 2005 and 2015. • Will the education/skills of these workers match employer demand? • AND…this does not even include the openings that will exist as people start to retire.
Labor force participation rates • Minnesota ranks 2nd nationwide for the percent of people age 16 to 64 who are in the labor force – 72.9% in 2006. • The labor force participation rate of women in Minnesota was 68.3% in 2006, the 2nd highest rate in the United States. • Minnesota teens (16 to 19 years of age) have one of the highest labor force participation rates in the country. • Minnesota ranks 7th nationwide in the employment rate of people with disabilities. • Trends show that labor force participation of people 65 years of age and over has been growing in the past 10 years. • Minneapolis-St. Paul MSA ranks 3rd nationwide in the percent of people 65 years of age and over engaged in the labor force - 25% in 2006. Source: BLS, Geographic Profile of Employment & Unemployment Cornell University, Rehabilitation Research and Training Center of Disability Demographics and Statistics
Connecting workforce supply and demand: some solutions • Education system working to meet demand • Getting the word out of youth and displaced workers • “Marketing” high demand occupations • Establishing career ladders in the workforce development system • Increase productivity • New technologies • More – and specialized – training • Outsource or offshore • Expand recruitment efforts and increase in-migration • Increase labor force participation (or lower unemployment) for certain groups
Minnesota-produced Labor Market Information is online at:www.deed.state.mn.us/lmi Rachel Hillman Regional Labor Market Analyst Phone: 651.642.0728 E-mail: rachel.hillman@state.mn.us