Download
1 / 22
220 likes | 308 Vues
Explore differences in O3 production mechanisms using NAQFC with CB05 and CBMIV versions. Analyze emissions, meteorological parameters, speciation variations, and systemic differences. Utilize the updated Carbon Bond Mechanism details for comprehensive analysis.

E N D
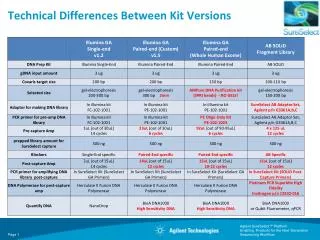
Investigating Differences in O3 Production from CB05 and CBMIV Versions of the NAQFC Rick Saylor, Hsin-Mu Lin, Pius Lee, Binyu Wang, TianfengChai, Ariel Stein, Daniel Tong, Hyun-Cheol Kim, YunsooChoi, FantineNgan, Daewon Byun 9th Annual CMAS Conference, Chapel Hill, NC, October 11-13, 2010
268 grid cells 442 grid cells National Air Quality Forecast Capability • Emissions: • EPA CEM anthropogenic inventories • 2005 base year projected to current year w/ EGU • BEIS V3 Biogenic Emissions • Met Model: • North American Model (NAM) • Non-hydrostatic Multi-scale Model (NMM) • 12 kmx 60 Levels • AQ Model: • USEPA Community Multiscale Air Quality (CMAQ) • CMAQ v4.6: 12 km/L22 CONUS Domain • Operational: CBMIV gas-phase • Experimental/Developmental: CB05/ AERO-4 PM • Output available on National Weather Service Air Quality Forecast Guidance website (http://www.weather.gov/aq) • 48 hour O3forecasts from 06/12 UTC Cycles • PM2.5 forecasts to be operational in FY2015 CONUS “5x” Domain
CB05 Ozone > CBM4 Ozone • Mechanism differences • Reactions responsible for ozone production? • Differences in speciation? CBM4 CB05 • Systemic differences • Precursor emissions? • Meteorological parameters? • Some process common to both CB05 and CBM4 2009
Updates to the Carbon Bond Mechanism: CB05 vs CBMIV G. Yarwood, S. Rao, M. Yocke, and G. Whitten, Updates to the Carbon Bond Chemical Mechanism: CB05, Final Report to U.S. EPA, December 8, 2005. Incorporates current (as of 2005) kinetic and photolysis data. Extends the CB mechanism to better support PM modeling needs such as SOA formation. Adds extra species and reactions to treat additional VOCs for air toxics study. Includes effect of reactive chlorine emissions in VOC degradation and oxidant chemistry. • • Explicit methylperoxy radical, methyl hydroperoxide and formic acid. • • Lumped higher organic peroxides, organic acids and peracids. • • Higher aldehyde species ALDX making ALD2 explicitly acetaldehyde. • • Recycling of NOy from organic nitrates. • Additional NOx recycling from HNO3, N2O5 and HO2NO2. • • Higher peroxyacyl nitrate species from ALDX called PANX. • • Explicit terpenegas phase chemistry.
Box Model Equations = concentration of species i in the box (µg/m3) = time dependent mixed layer height (m) = emission of species i into the box (µg/m2-s) = chemical production rate of species i within the box (µg/m3-s) = dry deposition velocity of species i (m/s) = background concentration of species i (µg/m3) = concentration of species i above the mixed layer (µg/m3) = mixing rate of background air (s-1)
Simulation Conditions • Fixed mixing layer height = 1000 m, • No dry deposition, • No mixing with background air, • Fixed initial conditions: T = 298 K • p = 1 atm • RH = 50% • O3 = 10 ppbv • CO = 100 ppbv • CH4 = 1600 ppbv • NOx = all VOCs = 0 Zaveri and Peters (1999) JGR, 104, 30387-30415.
Simulation Suite Hourly emission = E0 * cos(zenith angle)
Organic Nitrate (NTR) Chemistry in CBM4 Production – R55. ROR + NO2 → NTR R64. TO2 + NO → NTR R68. CRO + NO2 → NTR R78. ISOP + NO3 → … + 0.8 NTR + … R81. XO2N + NO → NTR R92. ISPD + NO3 → … + 0.85 NTR + … R94. ISOP + NO2 → … + 0.8 NTR + … No chemical destruction of NTR in CBM4, thus NTR is an irreversible sink for reactive nitrogen in CBM4.
Organic Nitrate (NTR) Chemistry in CB05 Production – R115. ROR + NO2 → NTR R129. TO2 + NO → … + 0.1 NTR + … R133. CRO + NO2 → NTR R144. ISOP + NO3 → … + 0.8 NTR + … R55. XO2N + NO → NTR R147. ISPD + NO3 → … + 0.85 NTR + … R156. ISOP + NO2 → … + 0.8 NTR + … R152. TERP + NO3 → … + 0.53 NTR + … Destruction – R61. NTR + OH → HNO3 + … R62. NTR + hν → NO2 + HO2 + … Reactive N is recycled back into the gas phase via R61 & R62. NTR is an irreversible Nsink in CBM4, but is a reversible temporary reservoir of Nin CB05. xNTRrecycle
Inorganic NOx Recycling Reactions in CB05 R51. HO2NO2 + hν → 0.61 HO2 + 0.61 NO2 + 0.39 OH + 0.39 NO3 R52. HNO3 + hν → OH + NO2 R53. N2O5 + hν → NO2 + NO3 CBM4 does not include these recycling pathways for NOx. NOTE: Removing these in the box model sensitivity test will likely overestimate the effect it will have on ozone in the full 3-D model because some HO2NO2, HNO3 and N2O5 will be removed via other processes (e.g., deposition and heterogeneous reactions). xiNOxrecycle
NTR and Inorganic NOx Recycling Reactions in CB05 R51. HO2NO2 + hν → 0.61 HO2 + 0.61 NO2 + 0.39 OH + 0.39 NO3 R52. HNO3 + hν → OH + NO2 R53. N2O5 + hν → NO2 + NO3 R61. NTR + OH → HNO3 + … R62. NTR + hν → NO2 + HO2 + … xallNOxrecycle
CB05 – CBM4 Ozone With NTR recycling reactions removed from CB05, differences in O3 between CB05 and CBM4 are substantially reduced (accounting for40-50% of ∆O3). CB05-xNTR – CBM4 Ozone
Conclusion • Box model sensitivity tests indicate that the primary causes of higher ozone biases from CB05 simulations are the additional NOx recycling pathways that were added to better represent the fate of NOx over multi-day timescales. This has resulted in a larger “effective” NOx level in the model (even with the same NOx emissions), which results in more O3 production. • Next Steps • Full-model sensitivity tests are underway to confirm the results of the box model simulations (results so far do confirm). • Future work will investigate individual chemical formation pathways of organic nitrates, compare predicted organic nitrate concentrations with available measurements, review all reactive N deposition parameters, and systematically re-evaluate NOx emission sources.