SQL Server 2012 BI Infrastructure: Reporting Services Development
Dive into SQL Server BI infrastructure and reporting services development for business intelligence solutions. Learn about cubes, dimensions, SSRS, and more. Develop rich, interactive reports for better business decision-making.

SQL Server 2012 BI Infrastructure: Reporting Services Development
E N D
Presentation Transcript
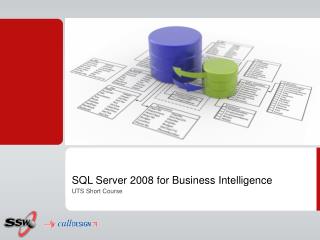
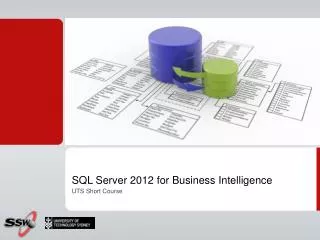
SQL Server 2012 for Business Intelligence UTS Short Course
Mehmet Ozdemir – SA @ SSW w: blog.ozdemir.id.au | e: mehmet@ssw.com.au | t: @mozdemir_au • SQL Server, BI, Infrastructure • Specializes in • Application architecture and design • SQL Performance Tuning and Optimization • HyperV, SCVMM • Technology aficionado • Virtualization • Reporting/BI • Cubes
Admin Stuff • Attendance • You initial sheet • Hands On Lab • You get me to initial sheet • Homework • Certificate • At end of 5 sessions • If I say if you have completed successfully
Course Website • http://sharepoint.ssw.com.au/Training/UTSSQL/Pages/default.aspx • Course Timetable • Course Materials
Last week(s) • Cubes • What is a cube? • Measures/Facts? • Dimensions? • Hierarchies? • Time Dimensions? • Cube Browser? • Why?
Homework • Where does the cube live? • Why do we need to provide "Impersonation Information" in our Data Source? • What is a dimension hierarchy?
Session 3: Tonight’s Agenda • What is SQL Reporting Services? • Steps in Creating a Report • Demo: Creating a Report • Hands on Lab
Business Intelligence Defined Business intelligence (BI) is a broad category of applications and technologies for gathering, storing, analyzing, and providing access to data to help enterprise users make better business decisions.
Step by step to BI • Create Data Warehouse • Copy data to data warehouse • Create OLAP Cubes • Create Reports • Do some Data Mining • Discovering a Relationship that was not obvious • Predict future events (e.g. targeting and forecasting)
What is SQL Server Reporting? • Reporting platform • Traditional • Interactive reports • Scalable and manageable server infrastructure • Integrated with • SharePoint • Office applications • Browser and other familiar tools • Single platform and tools for all types of structured data • Relational • Hierarchical • Multidimensional
SQL Server BI Platform Reporting Services Development Tools Management Tools Analysis Services OLAP & Data Mining Integration Services ETL SQL Server Relational Engine
Authoring Management Delivery Reporting Lifecycle • Reporting Services is an open and extensible platform supporting the authoring, management and delivery of rich, interactive reports to the entire enterprise.
Report Authoring • Reports are defined in Report Definition Language (RDL), a documented XML schema • Use Microsoft or 3rd party tools that support RDL • Create single reports from multiple data sources(SQL, OLE DB, ODBC, Oracle, and .NET data providers) More info on the RDL spec: http://bit.ly/11lcd3n
Report Authoring - Controls • Data regions • Tablix • Table • List (like Access) • Matrix • Chart • Gauge • Databar • Subreports • Images • Custom Controls • 3rd Party Controls
Tablix • Generalized layout report item • Grouped and Detail data
Tablix - Table • Use a table to display detail data • Organize the data in row groups, or both. • The Table template contains three columns with a table header row and a details row for data.
Tablix - Matrix • Use a matrix to display aggregated data summaries • Grouped in rows and columns, similar to a PivotTable or crosstab. • The number of rows and columns for groups is determined by the number of unique values for each row and column groups
Tablix - List • Use a list to create a free-form layout. You are not limited to a grid layout, but can place fields freely inside the list. • You can use a list to design a form for displaying many dataset fields or as a container to display multiple data regions side by side for grouped data.
Drill-through Reports • Start in Report Builder • Get the data you want • In report properties choose Allow users to drill to this report option • Optionally customize in Report Designer
Interactivity • Document maps • Collapse / Expand • Actions
Report Management • Report definitions, folders, and resources are published and managed in a reporting web service • Managed reports can be executed either on-demand or via schedule and can be cached for consistency and performance • Scalable & Extensible server architecture
Report Delivery • Traditional (paper) and interactive (web) reports • On-demand (“pull”) or event-based (“push”) delivery • Many formats (HTML, Excel, PDF, XML, Word, Zip File*) • Deliver reports to many devices (e-mail, file share, etc.) • Ad-hoc Reporting
SSRS and SSAS – Working Together Standard reports Ad hoc reports Detail reports SSAS SSRS • Intuitive reporting • Interactive analysis • High performance • Powerful calculations • Detail reporting • Standard reporting • Ad hoc reporting • Flexible delivery
SSAS and Reporting Services Data Layer SSAS Presentation Layer UnifiedDimensionalModel ETL DB1 Interactive reporting UDM DB2 DW Standard reporting DB3 multiple data sources supported Ad hoc reporting • Dimensional schema = intuitive reporting • SSAS for better performance and business metrics • UDM serves many reporting needs
Client side • Reportviewer Control in "local mode" • ASP.NET • Windows Forms • Silverlight • WPF • What about MVC? • http://stackoverflow.com/questions/15208437/how-can-i-use-a-reportviewer-control-with-razor
Resources • http://www.ssw.com.au/ssw/standards/Rules/RulesToBetterSQLReportingServices.aspx All about the ReportViewer control • http://www.gotreportviewer.com/
Usergroups SQL Server UG • http://www.ssw.com.au/ssw/netug/ • http://www.sqlserver.org.au/
Summary • What is Reporting Services? • Steps in Creating a Report • Demo: Creating a Report • Hands on Lab