Download
1 / 36
360 likes | 378 Vues
This poster summarizes the design, evaluation plan, and implementation of an interface, including observation methods and techniques for engaging users in evaluation. It also discusses the capturing of sessions and different software and tools that can be used.

E N D
Observation & Experiments Watch, listen, and learn…
Part 2 reminder • Report • Summary of poster • The design (features, explanations, screenshots, scenarios, etc. etc.) • The evaluation plan • The Prototype • And a brief writeup of how it was implemented and what pieces of the design it represents
Evaluation plan feedback • Connect your usability criteria with how you plan to test them • Be Very Detailed!! • Someone else could run the evaluation without you • Task list, script to follow, etc. • Questionnaire or interview questions
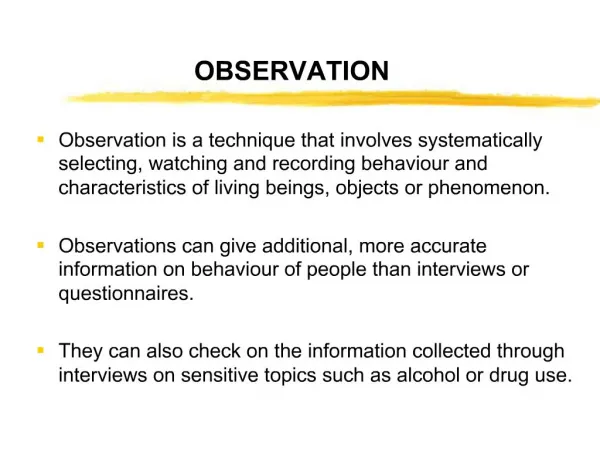
Observing Users • Qualitative & quantitative • End users • Experimental or naturalistic • One of the best ways to gather feedback about your interface • Watch, listen and learn as a person interacts with your system
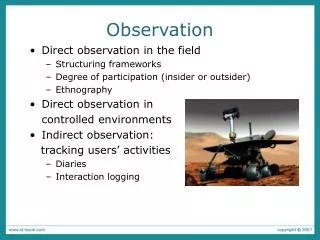
Direct In same room Can be intrusive Users aware of your presence May use 1-way mirror to reduce intrusiveness Indirect Video (cameras) or app (software logging) recording Reduces intrusiveness, but doesn’t eliminate it Gives archival record, but can spend a lot of time reviewing it Observation
Location • Observations may be • In lab - Maybe a specially built usability lab • Easier to control • Can have user complete set of tasks • In field • Watch their everyday actions • More realistic • Harder to control other factors
ObservationRoom • This observation room equipped with three monitors to view participant, participant's monitor, and composite picture in picture. • One-way mirror plus angled glass captures light and isolates sound between rooms. • Comfortable and spacious for three people, but room enough for six seated observers. • Digital mixer for unlimited mixing of input images and recording. • Other examples: http://www.noldus.com/site/doc200406061
Task Selection • What tasks are people performing? • Representative and realistic? • Tasks dealing with specific parts of the interface you want to test? • Problematic tasks? • Don’t forget to pilot your entire evaluation!! • A story
Engaging Users in Evaluation • What’s going on in the user’s head? • Use verbal protocolwhere users describe their thoughts • Qualitative techniques • Think-aloud - can be very helpful • Post-hoc verbal protocol - review video • Critical incident logging - positive & negative • Structured interviews - good questions • “What did you like best/least?” • “How would you change..?”
Think Aloud • User describes verbally what s/he is thinking and doing • What they believe is happening • Why they take an action • What they are trying to do • Widely used, popular protocol • Potential problems: • Can be awkward for participant • Thinking aloud can modify way user performs task
Cooperative approach • Another technique: Co-discovery learning (Constructive iteration) • Join pairs of participants to work together • Use think aloud • Perhaps have one person be semi-expert (coach) and one be novice • More natural (like conversation) so removes some awkwardness of individual think aloud • Variant: let coach be from design team (cooperative evaluation)
Alternative • What if thinking aloud during session will be too disruptive? • Can use post-event protocol • User performs session, then watches video afterwards and describes what s/he was thinking • Sometimes difficult to recall • Opens up door of interpretation
What if a user gets stuck? • Decide ahead of time what you will do. • Offer assistance or not? What kind of assistance? • You can ask (in cooperative evaluation) • “What are you trying to do..?” • “What made you think..?” • “How would you like to perform..?” • “What would make this easier to accomplish..?” • Maybe offer hints • This is why cooperative approaches are used
Inputs / Outcomes • Need operational prototype • could use Wizard of Oz simulation • What you get out • “process” or “how-to” information • Errors, problems with the interface • compare user’s (verbalized) mental model to designer’s intended model
Capturing a Session • Paper & pencil • Can be slow • May miss things • Is definitely cheap and easy Task 1 Task 2 Task 3 … Time 10:00 10:03 10:08 10:22 S e S e
Capturing a Session • Recording (screen, audio and/or video) • Good for think-aloud • Multiple cameras may be needed • Good, rich record of session • Can be intrusive • Can be painful to transcribe and analyze • Usability software: • Morae by Techsmith • Ovo Studios • Screencorder and other screen recording applications
Capturing a Session • Software logging • Modify software to log user actions • Can give time-stamped key press or mouse event • Two problems: • May be too low-level, want higher level events • Massive amount of data, need analysis tools
Example logs 2303761098721869683|hrichter|1098722080134|MV|START|566 2303761098721869683|hrichter|1098722122205|MV|QUESTION|false|false|false|false|false|false| 2303761098721869683|hrichter|1098724978982|MV|TAB|AGENDA 2303761098721869683|hrichter|1098724981146|MV|TAB|PRESENTATION 2303761098721869683|hrichter|1098724985161|MV|SLIDECHANGE|5 2303761098721869683|hrichter|1098724986904|MV|SEEK|PRESENTATION-A|566|604189|0 2303761098721869683|hrichter|1098724996257|MV|SEEK|PRESENTATION-A|566|604189|604189 2303761098721869683|hrichter|1098724998791|MV|SEEK|PRESENTATION-A|566|604189|604189 2303761098721869683|hrichter|1098725002506|MV|TAB|AGENDA 2303761098721869683|hrichter|1098725003848|MV|SEEK|AGENDA|566|149613|604189 2303761098721869683|hrichter|1098725005981|MV|TAB|PRESENTATION 2303761098721869683|hrichter|1098725007133|MV|SLIDECHANGE|3 2303761098721869683|hrichter|1098725009326|MV|SEEK|PRESENTATION|566|315796|149613 2303761098721869683|hrichter|1098725011569|MV|PLAY|566|315796 2303761098721869683|hrichter|1098725039850|MV|TAB|AV 2303761098721869683|hrichter|1098725054241|MV|TAB|PRESENTATION 2303761098721869683|hrichter|1098725056053|MV|SLIDECHANGE|2 2303761098721869683|hrichter|1098725057365|MV|SEEK|PRESENTATION|566|271191|315796 2303761098721869683|hrichter|1098725064986|MV|TAB|AV 2303761098721869683|hrichter|1098725083373|MV|TAB|PRESENTATION 2303761098721869683|hrichter|1098725084534|MV|TAB|AGENDA 2303761098721869683|hrichter|1098725085255|MV|TAB|PRESENTATION 2303761098721869683|hrichter|1098725088690|MV|TAB|AV 2303761098721869683|hrichter|1098725130500|MV|TAB|AGENDA 2303761098721869683|hrichter|1098725139643|MV|TAB|AV 2303761098721869683|hrichter|1098726430039|MV|STOP|566|271191 2303761098721869683|hrichter|1098726432482|MV|END
Analysis • Many approaches • Task based • How do users approach the problem • What problems do users have • Need not be exhaustive, look for interesting cases • Performance based • Frequency and timing of actions, errors, task completion, etc. • Can be very time consuming!!
Experiments Testing hypotheses…
Experiments • Test hypotheses in your design • Generally quantitative, experimental, with end users. • See 14.2.2
Types of Variables • Independent • What you’re studying, what you intentionally vary (e.g., interface feature, interaction device, selection technique, design) • Dependent • Performance measures you record or examine (e.g., time, number of errors)
“Controlling” Variables • Prevent a variable from affecting the results in any systematic way • Methods of controlling for a variable: • Don’t allow it to vary • e.g., all males • Allow it to vary randomly • e.g., randomly assign participants to different groups • Counterbalance - systematically vary it • e.g., equal number of males, females in each group • The appropriate option depends on circumstances
Hypotheses • What you predict will happen • More specifically, the way you predict the dependent variable (i.e., accuracy) will depend on the independent variable(s) • “Null” hypothesis (Ho) • Stating that there will be no effect • e.g., “There will be no difference in performance between the two groups” • Data used to try to disprove this null hypothesis
Example • Do people complete operations faster with a black-and-white display or a color one? • Independent - display type (color or b/w) • Dependent - time to complete task (minutes) • Controlled variables - same number of males and females in each group, no colorblind users • Hypothesis: Time to complete the task will be shorter for users with color display • Ho: Timecolor = Timeb/w • Note: Within/between design issues
Experimental Designs • Within Subjects Design • Every participant provides a score for all levels or conditions ColorB/W P1 12 secs. 17 secs. P2 19 secs. 15 secs. P3 13 secs. 21 secs. ...
Experimental Designs • Between Subjects • Each participant provides results for only one condition ColorB/W P1 12 secs. P2 17 secs. P3 19 secs. P5 15 secs. P4 13 secs. P6 21 secs. ...
Within Subjects Designs • More efficient: • Each subject gives you more data - they complete more “blocks” or “sessions” • More statistical “power”: • Each person is their own control • Therefore, can require fewer participants • May mean more complicated design to avoid “order effects” • Participant may learn from first condition • Fatigue may make second performance worse • e.g. seeing color then b/w may be different from seeing b/w then color
Between Subjects Designs • Fewer order effects • Simpler design & analysis • Easier to recruit participants (only one session, less time) • Less efficient
Defining Performance • Based on the task • Specific, objective measures/metrics • Examples: • Speed (reaction time, time to complete) • Accuracy (errors, hits/misses) • Production (number of files processed) • Score (number of points earned) • …others…? • Preference, satisfaction, etc. (i.e. questionnaire response) are also valid measurements
What about subjects? • How many? • Book advice:at least 10 • Other advice:6 subjects per experimental condition • Real advice: depends on statistics • Relating subjects and experimental conditions • Within/between subjects design
Now What…? • Performed initial data inspection • Removed outliers, have general idea what occurred • Descriptive Statistics • Totals, Averages, Ranges, etc. • Subgroup Statistics • Statistical Analysis • T-test and others to determine significance • More in 2 weeks…
Feeding Back Into Design • What were the conclusions you reached? • How can you improve on the design? • What are quantitative benefits of the redesign? • e.g. 2 minutes saved per transaction, which means 24% increase in production, or $45,000,000 per year in increased profit • What are qualitative, less tangible benefit(s)? • e.g. workers will be less bored, less tired, and therefore more interested --> better cust. service
Example: Web Page Structure • Breadth or depth of linking better? • Condition 1: 8 x 8 x 8 • Condition 2: 16 x 32 • Condition 3: 32 x 16 • 19 experienced users, 8 search tasks for each condition. Tasks chosen randomly from possible 128. • Results: • Condition 2 fastest (mean 36s, SD 16) • Condition 1 slowest (mean 58 s, SD 23) • Implies breadth preferable to depth, although too many links could hurt performance Larson & Czerwinski, 1998; see page 447 in ID
Questions: • What are independent variables? • What are dependent variables? • What could be hypothesis? • Between or within subjects? • What was controlled? • What other data could you gather on this topic? • What other experiments could you do on this topic?
Example: add video to IM voice chat? • Compare voice chat with and without video • Plan an experiment: • Compare message time or difficulty in communicating or frequency… • Consider: • Tasks • What data you want to gather • How you would gather • What analysis you would do after