Download
1 / 25
250 likes | 377 Vues
Solar Monday Seminar 04 th Oct., 2004 (Main : T. Morimoto). Arrival time of halo coronal mass ejections In the vicinity of the Earth. G. Michalek, N. Gopalswamy, A. Lara, and P.K. Manoharan. A&A 423 , 729-236 (2004). Introduction. Arrival time of interplanetary (IP) shock.

E N D
Solar Monday Seminar 04th Oct., 2004 (Main : T. Morimoto) Arrival time of halo coronal mass ejections In the vicinity of the Earth G. Michalek, N. Gopalswamy, A. Lara, and P.K. Manoharan A&A 423, 729-236 (2004)
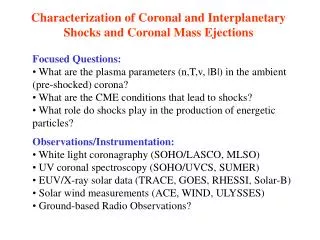
Introduction Arrival time of interplanetary (IP) shock. [Gopalswamy et al. 1998, 2001] The drift rate of type II radio bursts was used to determine the speed of shock and to develop a scheme to predict their appearance in the vicinity of the Earth. Poor connection between coronal shocks and IP shocks.
Halo CME WIND EARTH SUN u : initial velocity [km s-1] v : final velocity Introduction SOHO/LASCO CME and ICME (interplanetary CME) [Gopalswamy et al. 2000] • SOHO/LASCO initial velocity : 150-1050 km s-1 Effective acceleration due to interaction with the solar wind (a). • Wind/ACE spacecraft ICME velocity : 350-650 km s-1 v = u + a t ( t : transit time) a = 1.41 – 0.0035 u [m s-1]
Halo CME WIND EARTH SUN u : initial velocity v : final velocity Introduction v = u + a t ( t : transit time) a = 1.41 – 0.0035 u The shortcomings of this model : 1. Projection effects (SOHO/LASCO CMEs) 2. Background solar wind is variable. 3. Constant acceleration may not hold. 4. There may be acceleration cessation between Sun and Earth.
Introduction Projection effects 1. [Gopalswamy et al. 2001] Helios 1 Pioneer Venus Orbiter Limb CME a = 2.193 – 0.0054 u SUN v : final velocity u : initial velocity Figure 1 of Gopalswamy et al. 2001. A limb CME observed by the Solwind coronagraph is shown heading toward the Helios 1 spacecraft.
Halo CME SUN Introduction Projection effects 1. [Gopalswamy et al. 2001] SUN 36 degrees. [Average width, St.Cyr et al. 2000] The use of rigid cone model of CME resulted in worse correlation between the observed initial speed (CME) and estimated travel time.
EARTH SUN vsw : 400 km s-1 u : initial velocity Acceleration distance (acceleration phase) Constant velocity phase Introduction Acceleration cessation distance Halo CME [Gopalswamy et al. 2001] WIND a = 2.193 – 0.0054 u SUN u : initial velocity [km s-1] v : final velocity Arrival time
Introduction 0.95 AU Acceleration cessation distance [Gopalswamy et al. 2001] 0.76 AU The acceleration cessation distance of 0.76 AU yields the best match between the observed and predicted travel times. The mean error = 10.7 hr. Comparison between predicted and observed travel times. The two solid lines show the influence of acceleration-cessation distance (top: 0.95 AU; bottom: 0.76 AU). Please ignore the dotted line, here. From Fig. 6 in Gopalswamy et al. 2001
Introduction The difference of the present work and previous studies. • Larger number of samples (Present work includes CME evens from 1996 to the end of 2002, namely 83 events.; Paper-1 = 47 events) 2. Use of new method (Michalek et al. 2003) to minimize the projection effects for full halo CMEs. 3. Effective acceleration from two groups of CMEs only, which are expected to have no acceleration cessation between the Sun and Earth. 4. Dependent acceleration cessation distance on initial velocities.
Introduction Michalek et al. 2003 model. A correction for determining the CME initial speed. Assumption : Constant velocity Rigid cone. Radial motion only. The four parameters can be obtained by the velocities and the time difference obtained at the two opposite limbs. Schematic picture presenting the cone model of the halo CME. From the Fig.1 in Mechalek et al. 2003.
Data • To select Front side halo CME – ICME pairs. • (http://cdaw.gsfc.nasa.gov/CME_list) CME : SOHO/LASCO 1996 – 2002. ICME : WIND spacecraft (magnetic cloud & ejecta) 83 pairs 2. To determine an empirical relation between the effective acceleration and the initial space-speed. 49 halo CMEs were corrected with their initial propagation speed with the Michalek et al. 2003 model. 3. To obtain the transit time t.
Faster than predicted Slower than predicted Analysis The predicted (lines) and observed (symbols) travel times with the model of Paper-1 (: Gopalswamy et al. 2001) Acceleration cessation: a = 2.193 – 0.0054 u 1.0 0.75 0.5 (AU) 49 events with their initial velocity corrected. All 83 events without initial velocity correction.
Analysis Acceleration profile using the corrected space speeds of 49 halo CMEs (left panel) and 83 uncorrected CMEs with uncorrected initial velocities.
Acceleration (y-axis) values were obtained via Slower than predicted (invariable) Faster than predicted : Underestimation of the CME speed. : Overestimation of the CME speed. Acceleration cessation: 1.0 0.75 0.5 (AU) Analysis
Analysis Acceleration profile using the corrected space speeds of 49 halo CMEs (left panel) and 83 uncorrected CMEs with uncorrected initial velocities.
Slower than predicted Acceleration cessation: 1.0 0.75 0.5 (AU) Analysis CMEs seem to arrive later than the model predictions.
Analysis The disagreement between the observed and predicted travel might times arise from the followings. No information on when (or where) the acceleration ceases. A new approach in determining acceleration profiles. i) To compute a model using only two extreme cases, in which there is no acceleration and the acceleration still acting at 1AU. ii) The acceleration ceases when each CME reaches a speed equal to the mean solar wind speed (~ 450 km s-1)
uCME = VSW VCME >> VSW Analysis Acceleration profile using the corrected space speeds of 49 halo CMEs (left panel) and 83 uncorrected CMEs with uncorrected initial velocities.
Slower than predicted Faster than predicted Acceleration cessation: 1.0 0.75 0.5 (AU) Analysis i) Using no acceleration cessation profile.
Analysis ii) Acceleration cessation distance dependent on CME initial velocities. Acceleration for each CME ceases when the CME speed reaches 450 km s-1. Very good. Not so good.
uCME = VSW VCME >> VSW Analysis Acceleration profile using the corrected space speeds of 49 halo CMEs (left panel) and 83 uncorrected CMEs with uncorrected initial velocities.
Analysis Acceleration profile obtained by using the 83 initial velocity uncorrected events. Not so good. Acceleration for each CME ceases when the CME speed reaches 450 km s-1. Very good.
Error=8.07 hr Error=11.50 hr Error=12.30 hr Error=11.20 hr Analysis Error histogram 49 corrected 83 uncorrected From 49 corrected acceleration profile. 49 corrected 83 uncorrected From 83 uncorrected acceleration profile.
Summary The difference between the present work and previous work (Paper-1: Gopalswamy et al. 2001) 1. The present work considers only full halo CMEs (width=360 degrees) 2. The present work contains larger number of CMEs, and wider range of initial velocities. 3. A new method to correct the projected CME speed to the space- speed (Michalek et al. 2003). 4. Acceleration profile from two groups of CMEs only, in which there is no acceleration cessation. 5. The acceleration cessation for each CME event is dependent on its initial velocity.
Summary = 10.7 hr = 8.02/11.20 hr The error in Paper-1 (Gopalswamy et al. 2001) The error in the present work The limitations of this model. i) Partial halo CMEs. ii) Each population of CMEs may need a separate acceleration profile. iii) The effective acceleration may not depend only on the initial velocity. For example, it depends on the nature of the friction and properties of the solar wind.