Download
1 / 8
80 likes | 193 Vues
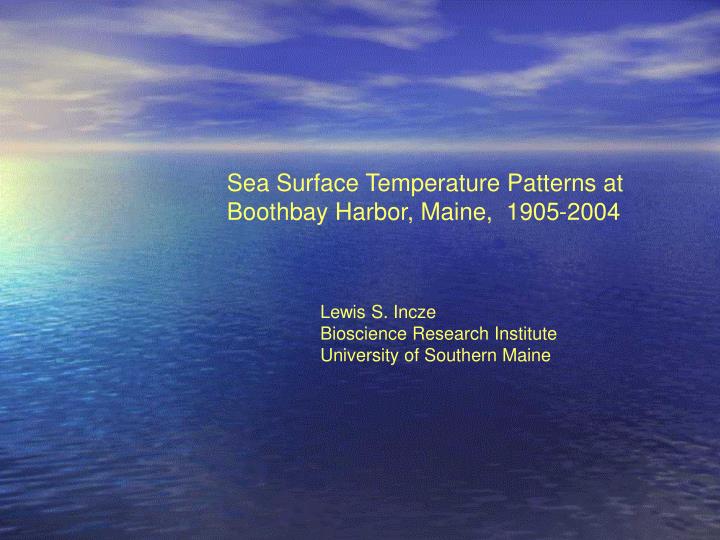
Sea Surface Temperature Patterns at Boothbay Harbor, Maine, 1905-2004. Lewis S. Incze Bioscience Research Institute University of Southern Maine.

E N D
Sea Surface Temperature Patterns at Boothbay Harbor, Maine, 1905-2004 Lewis S. Incze Bioscience Research Institute University of Southern Maine
The following slides look at surface temperature change in the Gulf of Maine, beginning with the long time-series from the Maine Department of Marine Resources dock in Boothbay Harbor (BBH), Maine (43.84º N, 69.64 º W ) which began in 1905 and consists of daily means which are now based on automated hourly data acquisition. The data were examined for missing values that would bias the calculations; months where all or too much data were missing are not plotted and the annual means for those years were not calculated. The second source of data is the Prince 5 time-series station located in 100 m of water in the southwestern Bay of Fundy (44.95º N, 66.81º W) and maintained by the Canadian Department of Fisheries and Oceans. The station was sampled once monthly beginning in 1924 and is now sampled twice monthly. From Prince 5 we have used only the annual means for those years with all 12 months sampled. We used data from 1924-2000 to look at differences between the two sites and to substantiate the two pronounced warming periods we see at BBH. Documentation of methods at both sites can be found through the institutional web sites. Data from Boothbay Harbor can be obtained through the Gulf of Maine Ocean Observing System (GoMOOS) website at http://www.gomoos.org/dmr/. Data from Prince 5 can be obtained through the website of the Atlantic Zone Monitoring Programme. A very nice climatology of the Gulf of Maine is located at http://www.mar.dfo-mpo.gc.ca/sabs/oceanographic.htm. We examine both the trends in annual mean temperatures and, more specifically, the monthly patterns of change (summer vs. winter warming trends). In Boothbay Harbor, the last decade (1990s) were marked by positive winter temperature anomalies and average summer temperatures. In the early 2000s the warming extended across all 12 months, and the annual means are now about 2.5º C warmer than during the mid 1960s. There are two such warming periods, the previous one being in the early 1950s. Prior to 1950, the data indicate that summers were warmer than the long-term mean, but not winters, which were cooler. Lewis Incze Bioscience Research Institute University of Southern Maine
Boothbay Harbor Annual SST Anomaly 1905 – 2003 Anomaly = deviation from 20th century mean, 1905-1999 Annual Anomaly Year: 1905 - 2004
Boothbay Harbor Monthly SST Anomaly 1905 – 2004 Anomaly = deviation from 20th century mean, 1905-1999 Month Year: 1905 - 2004
Close-up: Boothbay Harbor Monthly SST Anomaly 1951 – 2004 Anomaly = deviation from 20th century mean, 1905-1999 Month Year: 1951 - 2004
Comparison of Annual mean SST at Boothbay Harbor and Prince 5, 1924-2000. BBH at 43.84 N, 69.64 W; P5 at 44.947 N, 66.812 W
Linear regression (not shown) of BBH against P5: n=32, y = 1.28 x, r2 = 0.72; dashed line is 1:1 reference.
The difference between BBH and Prince 5 increases as annual temperature increases