Download
1 / 49
490 likes | 575 Vues
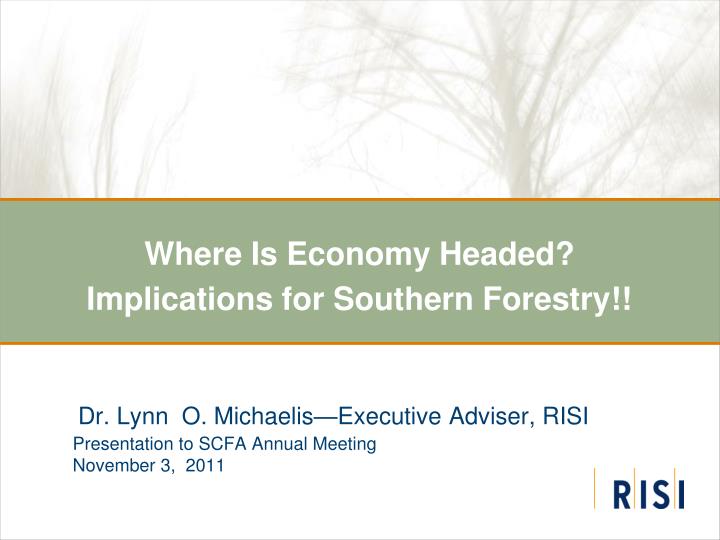
Where Is Economy Headed? Implications for Southern Forestry!!. Dr. Lynn O. Michaelis—Executive Adviser, RISI Presentation to SCFA Annual Meeting November 3, 2011. Where We are Going Today!. Understanding the situation: WHY? Economic and housing outlook Translation to wood products demand

E N D
Where Is Economy Headed?Implications for Southern Forestry!! Dr. Lynn O. Michaelis—Executive Adviser, RISI Presentation to SCFA Annual Meeting November 3, 2011
Where We are Going Today! • Understanding the situation: WHY? • Economic and housing outlook • Translation to wood products demand • Regional implications: logs and timber • Longer term: There WILL be a recovery
Bernanke’s said in 2010: “An unusually uncertain environment” Translation: flying blind
Unique cycle and source of global financial crisis
Perspective: More difficult than 1979-82 • Extremely low operating rate • “Depression” prices
Where We are Going Today! • Understanding the situation: WHY? • Economic and housing outlook
The Challenge: Economic Forecast given the NEW WORLD • Current best view: sluggish growth through 2012-13 • Key Driver: Consumer Spending -- not too exciting • Strong Business Investment last Quarter • Several Headwinds: Housing, State and Local Government, Politics for 2012 Election • Biggest Risk: European debt crisis (future of the Euro)
U.S. Growth : Revised down since May, with serious implications for employment • Key Driver: consumer spending, but.. • Employment • Confidence • Wealth • Strong Bus Investment • Modest boost from international—weaker Euro? • Truth: uncharted waters • Range of forecasts for 2012: .5%-3.5%
Falling home prices have serious wealth impact and potentially on consumer spending
Oil Prices Supported by Emerging Economies and Weak DollarWest Texas Intermediate Crude Oil, US$ per Barrel Source: Fed, RISI
Expect rates to remain flat through 2012: but not an issue for housing
Housing Outlook: Unique situation • Single-family still flat • Problems persist for SF into 2012 • Falling prices and foreclosure rates • Despite record affordability • Multifamily prospects improving • Vacancy rates, rents, absorption rates
Housing Outlook: Inventory correction with a TWIST • New Housing “Model”: THINKING About Plausible Recovery Patterns—no history to build econometric model • Correct approach: simulate inventory correction process—must eliminate excess before production recovers • How big is the excess inventory? • Determine annual housing “demand” vs. housing production • What type of units will be required—Single Family vs. Multi Family?— This is the Twist! • Then, simulate housing start trajectory given some key assumptions—BE CAREFUL HERE!!
Starting Point of 1.8 Million Excess Vacant Units, but it could be……
Forecasting basic housing demand: Simple? • Housing Demand=Net Household Growth + Net Removals + Second Home demand • Net Household Growth developed by age group=population growth and headship rate • Net Removals: 350,000-450,000 per year
Household Formations: Outlook based on April GDP and employment growth Starting point (April 2011) was 2.9% GDP growth and 3.4% in 2012
Illustration of economic impact on the younger age groups If headship rate had been stable: another 2 million household or 400,000/ year in housing demand
Simulating Housing Production and Tracking the Inventory Correction * Net removals assumption: 500,000/year
What type of units? Reason it is important Reference: 100,000 single family units need 1.5 billion bf lumber and 1.1 billion sq. ft. of OSB
Importance of Ownership Rate for Mix of Housing Units Started *At 65.9% in 2011.2 and falling
Step 3: Mix of Starts Determined by Ownership Rate Trends • Key driver for housing mix • Drove single family housing boom/bubble—now…
Existing Home Sales Hard to Interpret –New Homes Message Clear
Small boost in product demand from R&R • Lag home sales • Modest growth in 2012, but recent events are not helping • Given who is buying existing homes: focus on improvements not additions
Where We are Going Today! • Understanding the situation: WHY? • Economic and housing outlook • Translation to wood products demand
Given housing outlook, wood products demand outlook through 2013 is:
Lumber Prices: Bouncing off bottom and some very different regional factors SPF reflects export market SYP closes on SPF
Key factor in cash cost and price outlook: C$ forecast *based on RISI mill surveys
Demand for N.A. Lumber: Very slow improvement in overall demand
Exports: No Indication That South Is Making Significant Inroads in the Offshore Export Market
Bottom Line: Prices near cash costs and SYP reflects domestic market
Where We are Going Today! • Understanding the situation: WHY? • Economic and housing outlook • Translation to wood products demand • Regional implications: logs and timber • Longer term: There WILL be a recovery
Log prices follow lumber prices • Overall harvest remains far below peak and sustainable levels • Inventory building in the U.S. • Western prices reflect impact of lumber price rebound and log exports to China • Southern log market: very different story for sawtimber and pulpwood • Canadian constraint becomes apparent as recovery proceeds, but not an issue in 2011-12sd
West benefits from China while the South remains depressed… (Delivered Sawtimber Prices Compared, $/MBF, Scrib., qtrly) *Third quarter is based on July average. **Assumes 7.5 short tons per MBF.
US log exports to China are contracting in July-August (Million M3) 25% ofharvest demand Note: Includes Alaska
Both Regions recover slowly with overall demand, but…. (BBF, Softwood Sawtimber Demand*) Western mills benefits from log exports Slower demand recovery in South *Coast and Inland region combined.
Stumpage price reflects expected SYP lumber prices SYP Stumpage, $/GST
U.S. Southern Pine Pulpwood outlook positive for several reasons
Where We are Going Today! • Understanding the situation: WHY? • Economic and housing outlook • Translation to wood products demand • Regional implications: logs and timber • Longer term: There WILL be a recovery
Recovery eventually happens and will sustain!!! When will be get to “trend” demand?What will be capacity/harvest limit? Beetle kill is a constraint on BC Harvest long-term
Back to the beginning premise: Planning for Recovery • VERY DIFFERENT THAN THE 1980’S: • CLEAR SUPPLY CONSTRAINTS • DEMAND RECOVERY THE PROBLEM THIS TIME • UNLIKE PAPER: • DEMAND WILL EVENTUALLY RECOVER • NO MAJOR INTERNATIONAL THREAT TO SOFTWOOD STRUCTURAL GRADE PRODUCTS • VERY POSITIVE OUTLOOK FOR N.A. WOOD AND TIMBER INDUSTRY BEYOND 2015: THERE WILL BE A RECOVERY!!!!
What questions OR COMMENTS do you have? Contact: Lynn Michaelis lmichaelis@risi.com 206-434-8102