ACME: a platform for benchmarking distributed applications
ACME: a platform for benchmarking distributed applications. David Oppenheimer, Vitaliy Vatkovskiy, and David Patterson ROC Retreat 12 Jan 2003. Motivation. Benchmarking large-scale distributed apps (peer-to-peer, Grid, CDNs, ...) is difficult very large (1000s-10,000s nodes)

ACME: a platform for benchmarking distributed applications
E N D
Presentation Transcript
ACME: a platform for benchmarking distributed applications David Oppenheimer, Vitaliy Vatkovskiy, and David Patterson ROC Retreat 12 Jan 2003
Motivation • Benchmarking large-scale distributed apps (peer-to-peer, Grid, CDNs, ...) is difficult • very large (1000s-10,000s nodes) • need scalable measurement and control • nodes and network links will fail • need robust measurement and control • large variety of possible applications • need standard interfaces for measurement and control • ACME: platform that developers can use to benchmark their distributed applications
ACME benchmark lifecycle • User describes benchmark scenario • node requirements, workload, faultload, metrics • System finds the appropriate nodes, starts up the benchmarked application on those nodes • System the executes scenario • collects measurements • inject workload and faults note: same infrastructure for self-management (just replace “fault” with “control action” and “benchmark scenario” with “self-management rules”or “recovery actions”)
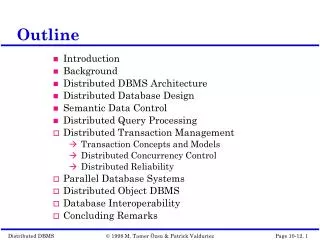
Outline • Motivation and System Environment • Interacting with apps: sensors & actuators • Data collection architecture • Describing and executing benchmark scenario • Resource discovery: finding appropriate nodes in shared Internet-distributed environments • Conclusion
Sensors and actuators • Source/sink for monitoring/control • Application-external: node-level • sensors • load, memory usage, network traffic, ... • actuators • start/kill processes • reboot physical nodes • modify emulated network topology • Application-embedded: application-level • initial application type: peer-to-peer overlay networks • sensors • number of application-level msgs sent/received • actuators • application-specific fault injection • change parameters of workload generation
Outline • Motivation and System Environment • Interacting with apps: sensors & actuators • Data collection architecture • Describing and executing benchmark scenario • Resource discovery: finding appropriate nodes in shared Internet-distributed environments • Conclusion
Query processor architecture query HTTP URL ISING SenTree childrens’values HTTP CSV data SenTreeDown SenTreeDown/SenTreeUp SenTreeDown/SenTreeUp SenTreeDown sensor HTTP CSV data aggregated response HTTP URL SenTree ISING query childrens’ values
Query processor (cont.) • Scalability • efficiently collect monitoring data from thousands of nodes • in-network data aggregation and reduction • Robustness • handle failures in the monitoring system and monitored application • query processor based on self-healing peer-to-peer net • partial aggregates on failure • Extensibility • easy way to incorporate new monitoring data sources as the system evolves • sensor interface
Outline • Motivation and System Environment • Interacting with apps: sensors & actuators • Data collection architecture • Describing and executing benchmark scenario • Resource discovery: finding appropriate nodes in shared Internet-distributed environments • Conclusion
Describing a benchmark scenario • Key is usability: want easy way to define when andwhat actions to trigger • “kill half of the nodes after ten minutes” • “kill nodes until response latency doubles” • Declarative XML-based rule system • conditions over sensors => invoke actuators
<action ID="1" name="startNode" timerName="T"> <params numToStart="100"/> <conditions> <condition type="timer" value="0"/> </conditions> </action> <action ID=“2" name="stopSensor" timerName="T"> <params sensorName="oldVal"/> <conditions> <condition type="timer" value="600000"/> </conditions> </action> <action ID=“3" name="killNode" timerName="T"> <params killNumber="10"/> <repeatperiod="180000"/> <conditions> <condition type="timer" value="600000"/> <condition type="sensor" ID="oldVal" datatype="double" name="latency" hosts="ibm4.CS.Berkeley.EDU:34794 host2:port2" node="ALL:3333" period="10000" sensorAgg="AVG“ histSize="1" isSecondary="true"/> <condition type="sensor" datatype="double" name="latency" hosts="ibm4.CS.Berkeley.EDU:34794 host2:port2" node="ALL:3333" period="10000" sensorAgg="AVG“ histSize="1" operator="<" ID="oldVal" scalingFactor="2"/> </conditions> </action> “Start 100 nodes. Starting 10 minutes later, kill 10 nodes every 3 minutes until latency doubles”
ACME architecture experimentspec./sys.mgmt. policy query HTTP URL XML ISING SenTree controller XML childrens’values HTTP CSV data SenTreeDown SenTreeDown/SenTreeUp SenTreeDown/SenTreeUp SenTreeDown sensor HTTP CSV data aggregated response HTTP URL SenTree ISING query childrens’ values HTTP URL HTTP CSV data actuator
ACME recap • Taken together, the parts of ACME provide • application deployment and process management • data collection infrastructure • workload generation* • fault injection* • ...all driven by a user-specified policy • Future work (with Stanford) • scaling down: integrate cluster applications • sensors/actuators for J2EE middleware • target towards statistical monitoring • use rule system to invoke recovery routines • benchmark diagnosis techniques, not just apps • new, user-friendly policy language • include expressing statistical algorithms
Benchmarking diagnosis techniques fault injection XML experimentspec. XML queries controller ISING or other query processor monitoring metrics subscr. reqs mon. data & events / queries diagnosisevents & subscr. reqs. pub/sub rule-based diagnosis statistical diagnosis statistical diagnosis fault injection monitoring metrics history
Revamping the language “Start 100 nodes. Starting 10 minutes later, kill 10 nodes every 3 minutes until latency doubles” when (timer_T > 0) startNode(number=100); when ((timer_T > 600000) AND sensorCond_CompLatency) killNode(number=10) repeat(period=180000); when (timer_T > 610000) stopSensor(name=oldVal); define sensorCond CompLatency { hist1 < 2 * hist2 } define history hist1 { sensor=lat, size=1 } define history hist2 { sensor=oldVal, size=1 } define sensor lat { name="latency" hosts="ibm4.CS.Berkeley.EDU:34794 host2:port2“ node="ALL:3333" period="10000“ sensorAgg="AVG" } define sensor oldVal lat;
Outline • Motivation and System Environment • Interacting with apps: sensors & actuators • Data collection architecture • Describing and executing benchmark scenario • Resource discovery: finding appropriate nodes in shared Internet-distributed environments • Conclusion
Resource discovery and mapping • When benchmarking, map desired emulated topology to available topology • example: “find me 100 P4-Linux nodes with inter-node bandwidth, latency, and loss rates characteristic of the Internet as a whole and that are lightly loaded” • When deploying a service, find set of nodes on which to execute to achieve desired performance, cost, and availability • example: “find me the cheapest 50 nodes that will give me at least 3 9’s of availability, that are geographically well-dispersed, and that have at least 100 Kb/sec of bandwidth between them”
Current RD&M architecture • Each node that is offering resources periodically reports to a central server • single-node statistics • inter-node statistics expressed as N-element vector • central server builds an NxN “inference matrix” • currently statistic values are generated randomly • When desired, a node issues a resource discovery request to central server • MxM “constraint matrix” [ load=[0,2] latency=[[10ms,20ms],[200ms,300ms]] ] [ load=[0,2] latency=[[10ms,20ms],[200ms,300ms]] ] [ load=[0,2] latency=[[200ms,300ms],[200ms,300ms]] ] • Central server finds the M best nodes and returns them to the querying node
RD&M next steps • Decentralized resource discovery/mapping • replicate needed statistics close to querying nodes • improves avail. and perf. over centralized approach • Better mapping functions • NP-hard problem • provide best mapping within cost/precision constraints • Give user indication of accuracy and cost • Integrate with experiment description language • Integrate with PlanetLab resource allocation • Evaluation
Conclusion • Platform for benchmarking distributed apps • Collect metrics and events • sensors • ISING query processor • Describe & implement a benchmark scenario • actuators • controller/rule system: process mgmt., fault injection • XML-based (to be replaced) • Next steps • resource discovery/node mapping • improved benchmark descr./resource discovery lang. • incorporating Grid applications • incorporating cluster applications and using to benchmark diagnosis techniques (with Stanford)