Why is this happening?
290 likes | 502 Vues
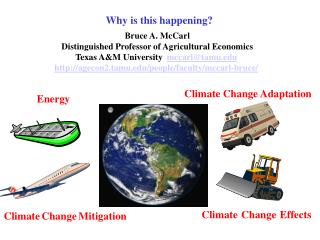
Why is this happening?. Bruce A. McCarl Distinguished Professor of Agricultural Economics Texas A&M University mccarl@tamu.edu http://agecon2.tamu.edu/people/faculty/mccarl-bruce/. Climate Change Adaptation. Energy. Climate Change Effects. Climate Change Mitigation.

Why is this happening?
E N D
Presentation Transcript
Why is this happening? Bruce A. McCarl Distinguished Professor of Agricultural Economics Texas A&M University mccarl@tamu.edu http://agecon2.tamu.edu/people/faculty/mccarl-bruce/ ClimateChangeAdaptation Energy ClimateChangeEffects ClimateChangeMitigation
Degree of climate change Why is this happening IPCC (1995) “The balance of evidence suggests a discernible human influence on global climate.” IPCC (2001) “Most of the warming of the past 50 years is likely (>66%) to be attributable to human activities.” IPCC (2007) ”Most of the observed increase in global average temperatures since the mid-20th century is very likely (>90%) due to the observed increase in anthropogenic (human emission caused)greenhouse gas concentrations.”
Degree of climate change Why is this happening Some gases, like carbon dioxide (CO), trap heat in the atmosphere by absorbing longwave radiation while letting the Sun's energy pass through. The transparent roof and walls of a greenhouse allow in the sunlight while keeping in the heat. Since these gases act similarly in the atmosphere, we call them greenhouse gases. Source : U.S. National Assessment/ http://www.usgcrp.gov/usgcrp/Library/nationalassessment/images/Greenhouse-s.jpg.
Why is this happening GHG Concentration Counting Non CO2 this increase is almost 450ppm • Pre industrial - 275 • - 345 • 2012 average - 394 http://co2now.org/
Degree of climate change Why is this happening Greenhouse gas radiation reflection Increase in CO2 concentration Plus CH4 N2O Energy related emissions Energy – development relationship Growth of BRIC economies Data 1750-2007
This Climate Change has a physical cause Source : http://campus.pc.edu/faculty/rarts/courses/physics/105/notes/Topic_5_The_Planets/Greenhouse_effect.jpg
Degree of climate change Why is this happening
Degree of climate change Why is this happening • Pre industrial - 275 Counting Non CO2 • - 345 this almost doubles • Jan 2013: 395.6 pre industrial • Jan 2012: 393.1 http://www.esrl.noaa.gov/gmd/ccgg/trends/
Degree of climate change - Why is this happening http://cdiac.ornl.gov/pns/current_ghg.html
Degree of climate change Why is this happening The concentration of all GHGs, including cooling aerosols that are relevant in the context of the 2oC temperature target, reached a value of 399 ppm CO2 equivalents in 2009. The concentration in 2009 of the six greenhouse gases (GHG) included in the Kyoto Protocol has reached 439 ppm CO2 equivalent, an increase of 160 ppm (around +58%) compared to pre-industrial levels. The concentration of CO2, the most important greenhouse gas, reached a level of 386 ppm by 2009, and further increased to 389 ppm in 2010. This is an increase of approximately 110 ppm (around +39%) compared to pre-industrial levels. http://www.eea.europa.eu/data-and-maps/indicators/atmospheric-greenhouse-gas-concentrations-2/assessment
Degree of climate change - Why is this happening CO2 and temperature linked but does not lead http://www.whrc.org/resources/online_publications/warming_earth/scientific_evidence.htm
microns 50 16.7 10 7.14 Why is this happening - Radiation Escaping earth emission with today’s atmosphere; ground temperature adjusted to balance the radiation (no clouds) http://geosci.uchicago.edu/~archer/cgimodels/radiation.html emitted high in the atmosphere from carbon dioxide
What is a Greenhouse Gas and how do they compare? The Kyoto Protocol covers a basket of six greenhouse gases (GHGs) produced by human activities: carbon dioxide, methane, nitrous oxide, hydrofluorocarbons, perfluorocarbons and sulphur hexafluoride. Annex I Parties emissions of these gases taken together are to be measured in terms of carbon dioxide equivalents on the basis of the gases global warming potential. An important natural GHG that is not covered by the Protocol is water vapor. Not all gasses are created equal and have different efficiencies in trapping radiation hereafter called radiative forcing. In particular, Carbon dioxide (CO2), methane (CH4), and nitrous oxide (N2O) are very different gases in terms of their heat trapping potential. The IPCC has established CO2 as the reference gas for comparison of relative heat-trapping potential (also known as global warming potential or GWP). GWP of 1kilogram (kg) of CO2 is 1. CH4 has a GWP of 21, which means that 1 kg of methane has the same heat- trapping potential as 21 kg of CO2. N2O has a GWP of 310. PFCs are potent; GWPs are 6,500 for CF4 and 9,200 for C2F6.
Emissions from human activity have increased over time Emissions of greenhouse gases and aerosols due to human activities continue to alter the atmosphere in ways expected to affect climate. Changes in climate occur as a result of factors in climate system and external factors (both natural and anthropogenic- caused by humans). Scientists have a word we use to distinguish changes that people have introduced to the environment from processes which are natural -- anthropogenic. Source : IPCC/.
Global Emissions Share Figure SPM.3. (a) Global annual emissions of anthropogenic GHGs from 1970 to 2004.5 (b) Share of different anthropogenic GHGs in total emissions in 2004 in terms of carbon dioxide equivalents (CO2-eq). (c) Share of different sectors in total anthropogenic GHG emissions in 2004 in terms of CO2-eq. (Forestry includes deforestation.) {Figure 2.1}
Degree of climate change – Texas and GHGs 2003 State by State Energy related CO2 emissions -- Texas wins Emissions growing Most emissions from energy US EPA, http://www.eia.doe.gov/environment.html US EIA, http://www.eia.doe.gov/environment.html
Global Greenhouse Gas Data http://www.epa.gov/climatechange/emissions/globalghg.html http://cdiac.ornl.gov/trends/emis/overview_2009.html
World GHG emissions - by country http://www.climatechangeconnection.org/emissions/GlobalchangesinGHG.htm
World GHG emissions - by country Figure TS.4a: Distribution of regional per capita GHG emissions (all Kyoto gases including those from land-use) over the population of different country groupings in 2004. The percentages in the bars indicate a region’s share in global GHG emissions [Figure 1.4a]. http://www.ipcc.ch/pdf/assessment-report/ar4/wg3/ar4-wg3-ts.pdf
1- Per-capita fossil-fuel CO2 emissions, 2005 World emissions: 27 billion tons CO2 AVERAGE TODAY STABILIZATION Source: IEA WEO 2007 and Socolow presentation at Americas Climate Choices
Emissions concentrations and forcing • Changes in atmospheric GHG concentrations, aerosols, land cover and solar radiation alter the energy balance of the climate system. • Global GHG emissions due to human activities have grown since pre-industrial times, with an increase of 70% between 1970 and 2004 • Carbon dioxide (CO2) is most important anthropogenic GHG. Annual emissions grew by about 80% between 1970 and 2004. • Global atmos. concentrations of CO2, methane (CH4) and nitrous oxide (N2O) have increased markedly due to humans since 1750 and now far exceed pre-industrial values determined from ice cores spanning many thousands of years (320,000+). • Atmospheric concentrations of CO2 (379ppm) and CH4 (1774ppb) in 2005 far exceed natural range over last 650,000 years. • Increases in CO2 primarily fossil fuel use, with land-use change also significant . • CH4 concentration is predominantly due to agriculture and fossil fuel use. • N2O concentration is primarily due to agriculture. {2.2} • During past 50 years, sum of solar and volcanic forcings would likely have produced cooling.
Emissions concentrations and forcing Source : IPCC Science of Climate Change
Size of Potential Emissions Atmosphere 800 PgC (2004) Biomass ~500 PgC N. Gas ~260 PgC Oil ~270 PgC Soils ~1,500 PgC Coal 5,000 to 8,000 PgC Unconventional Fossil Fuels 15,000 to 40,000 PgC Source Jae Edmonds, Joint Global Change Research Institute at the University of Maryland
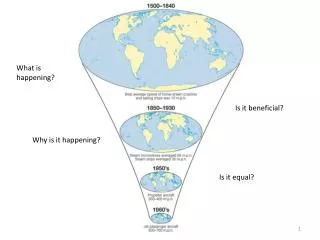
Future emissions are mostly projected to increase Figure 2-9: CO2 Emissions in Global Futures Scenarios (narrative scenarios). Acronyms: OCF, the “Our Common Future” scenario from Duchin et al., 1994; GS, the “Global Shift”; ER, the “European Renaissance”; GC, the “Global Crisis”; and BG the “Balanced Growth” scenarios from the Central Planning Bureau of the Netherlands (CPB, 1992); A1, A2, A3, B, C1 and C2, scenarios from Nakicenovic et al., 1998; CW-R, “Conventional Worlds – Reference”; and CW-PR, “Conventional Worlds – Policy Reform” from Gallopin et al., 1997 and Raskin et al., 1998. Source IPPC 2001:Mitigation
Future emissions are mostly projected to increase Data from http://www.eea.europa.eu/data-and-maps/figures/observed-and-projected-changed-in-the-overall-kyoto-gasses-fig-1a-and-all-greenhouse-gasses-expressed-in-co2-equivalents-ipcc-2007a-partly-based-on-ipcc-2001-2