KRT Oklahoma
Detailed analysis of Oklahoma's industry clusters from 2002 to 2011, including jobs, earnings, and key sectors. Data from EMSI provides insights for economic development strategies.

KRT Oklahoma
E N D
Presentation Transcript
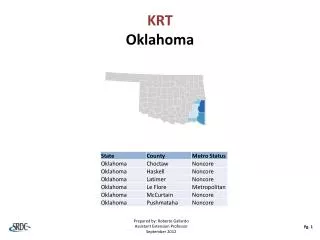
KRTOklahoma Prepared by: Roberto Gallardo Assistant Extension Professor September 2012 Pg. 1
KRT – Oklahoma Pre-Defined* Clusters *For a list of six-digit NAICS codes industries within each cluster see separate file Source: EMSI Complete employment – 2011.4 Last Updated: March 2012 Pg. 2
KRT – Oklahoma (2002-2007) Machinery 2002-2007 % Change Jobs Transp. Equipment Energy Transp. & Logistics Biomedical Ag. Business Printing Forest Primary Metal 2007 LQ Pg. 3 Bubble size represents cluster’s average earnings in 2011 ; Source: EMSI Complete Employment – 2011.4
KRT – Oklahoma (2006-2011) Fabricated Metal Adv. Material Printing 2006-2011 % Change Jobs Business & Financial Machinery Biomedical Transp. &Logistics Ag. Business Energy Mining Forest Transp. Equipment 2011 LQ Pg. 4 Bubble size represents cluster’s average earnings in 2011; Source: EMSI Complete Employment – 2011.4
KRT –Oklahoma 2002-2007 Bubble Chart Results *Clusters were ranked in descending order based on their 2007 LQ Source: EMSI Complete Employment – 2011.4 Pg. 5
KRT –Oklahoma 2006-2011 Bubble Chart Results *Clusters were ranked in descending order based on their 2011 LQ Source: EMSI Complete Employment – 2011.4 Pg. 6
KRT –Oklahoma 2011 Expenditures & Leakage* *Only top 20 industries used to calculate the leakage Sorted in descending order based on total expenditures Source: EMSI Complete Employment – 2011.4 Pg. 7