Image Forgery Detection
Image Forgery Detection. by Gamma Correction Differences. Introduction ( definitions ). PIM – photographic images PRCG – photorealistic computer graphics We want to decide for image: PIM PRCG. CG Images From the Google. Introduction ( cont. ). Introduction ( cont. ).

Image Forgery Detection
E N D
Presentation Transcript
Image Forgery Detection by Gamma Correction Differences
Introduction ( definitions ) • PIM – photographic images • PRCG – photorealistic computer graphics • We want to decide for image: PIM PRCG
CG Images From the Google Introduction ( cont. )
Introduction ( cont. ) • Previous natural image statistic techniques can distinguish PIM or PRCG (wavelet method 67% detection and 1% false alarm), but can’t answer the question how PIM are actually different from PRCG. • Here proposed new geometry-based image model which is inspired by the physical generation process of PIM and PRCG.
Definition of authenticity • What about photographs of CG or forgery? • So here defined two types of authenticity: 1) image-process authenticity (here) 2) scene authenticity (statistic methods too)
Image generation process • The main differences between PIM and PRCG: 1) Object Model Difference : The surface of real-world objects, except for man-made objects, are rarely smooth of simple geometry.
Image generation process (cont.) 2)Light Transport Difference:The physical light field captured by a camera is a result of the physical light transport from the illumination source, reflected to the image acquisition device by an object.
Image generation process (cont.) 3)Acquisition Difference: PIM carry the characteristics of the imaging process, while PRCG may undergo different types of post-processing. There is no standard set of post-processing techniques, but a few possible ones are the simulation of the camera effect, such as the depth of field, gamma correction, addition of noise, and retouching.
Optics (mechanics) • Different field of view, different size, different quality (cheap lenses causes more filtering and reflecting). • Very important issue – lens protectors (causes reflecting).
Detector (CCD) • Each pixel converts number of photons to variable number of electrons. • So we have the detector noise
Read Out • We must to bring all pixels into dynamic range (similar to white balance). • Electronic noise. • After read out block we can see analog image.
Acquisition Difference Gamma Correction • Gamma Correction - controls the overall brightness of an image. Images which are not properly corrected can look either bleached out, or too dark. In other words to enhance the contrast of the displayed images.
Gamma Correction (cont.) Sample Input Graph of Input Gamma Corrected Input Graph of Correction L' = L ^ (1/2.5)
Gamma Correction (cont.) • Most monitors have build-in Gamma correction. It will be compensated by image processing algorithm. For example : For most CRT monitors, gamma correction must output gamma = ½ to get “correct” image.
Gamma Correction (cont.) The left image too dark! Right image gamma corrected ( looks “correct” ).
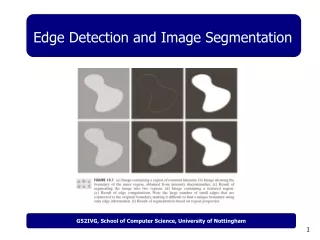
Acquisition Difference Gradient on surface • In this section, we will show that the surface gradient of the image intensity function I(x,y) can be used to distinguish PIM and PRCG.
Gradient on surface ( cont. ) • One main characteristic of the camera transfer function is that the irradiance of low values are stretched and those of high values are compressed. Let the image intensity function be I (x, y) = f (M(x, y)) where f : R → R is the camera transfer function and M : R^2 → R is the image irradiance function.
By the chain rule, we have: The modulation factor , is the derivative of the camera function, which is larger (smaller) than 1 when M is small (large) Gradient on surface ( cont. )
Therefore, the Euclidean gradient : of a transformed image is higher (lower) at the low (high) intensity than before the transformation. Gradient on surface ( cont. )
Gradient on surface ( cont. ) • , the modulation term reveals a key difference between PIM and PRCG, when PRCG images are not subjected to such modulation on their gradient values. If the PRCG intensity functions have not undergone such transformation, it can be distinguished from PIM by the gradient distribution.
The analysis above assumes that the image irradiance function M is continuous. There is a non-trivial issue involved in its implementation, when it comes to discrete sampled images. Consider approximating the gradient at two neighboring pixels at locations x and x + ∆x, intensity derivative Equation becomes: Where ∆Ix = I (x +∆x, y )−I (x, y) similarly for ∆(f ◦M )x and ∆Mx. Gradient on surface ( cont. )
Gradient on surface ( cont. ) • Note that, the modulation factor in this case becomes the slope of the chord on the camera transfer function connecting M (x+∆x) to M (x). One consequence is that the modulation will only be similar to the continuous case, when M (x +∆x )−M (x) is small, because when M (x +∆x )−M (x) is large, the slope of the chord is approaching 1 and modulation effect is weak. In other words, due to the discrete representation, the modulation effect shown in Equation will arise only at points having low gradient values.
To emphasize the low-gradient region, we employ a tail-compressing transform, S: In right Figure shows that the S transform is almost linear for the small values and it compresses the high values. The width of the linear range can be controlled by the constant, α. Gradient on surface ( cont. )
Gradient on surface ( results ) • Next Figure shows the distribution of the mean of surface gradient | grad (αI) | α = 0.25 (selected such that the linear range of the S transform covers the low and the intermediate of the Euclidean gradient), for three intensity ranges, i.e.: [0, 0.33] , [0.33, 0.66], [0.66, 1] of the blue color channel (the same holds for the red and green channels).
Gradient on surface ( Results ) These distributions are computed empirically from our actual dataset of PIM and PRCG. Notice that for the low intensity region, the mean of surface gradient for the PIM is higher than that of the PRCG and the opposite is observed for the high intensity region, while the distributions of the two are completely overlapped at the medium intensity range. This perfectly matches our prediction about the effect of the transfer function!
Conclusion • We have proposed a new approach for PIM and PRCG classification in the context of image forgery detection. This approach don’t need any natural image statistics information. Even can distinguish between PIM with different gamma correction function.
Discussion • What about PRCG + gamma correction? • What about combining this method with others?
References • [1] S. Lyu and H. Farid. How realistic is photorealistic? IEEE Trans. Signal Processing, 53(2):845–850, February 2005. • [2] Tian-Tsong Ng, Shih-Fu Chang, Jessie Hsu, Lexing Xie. Physics-Motivated Features for Distinguishing Photographic Images and Computer Graphics.