Download
1 / 1
10 likes | 136 Vues
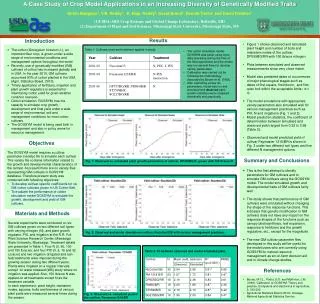
A Case Study of Crop Model Applications in an Increasing Diversity of Genetically Modified Traits Girish Badgujar 1 , V.R. Reddy 1 , K. Raja. Reddy 2 , David Brand 2 , Dennis Timlin 1 and David Fleisher 1

E N D
A Case Study of Crop Model Applications in an Increasing Diversity of Genetically Modified Traits Girish Badgujar1, V.R. Reddy1, K. Raja. Reddy2, David Brand2, Dennis Timlin1 and David Fleisher1 (1)USDA-ARS Crop Systems and Global Change Laboratory, Beltsville, MD(2) Department of Plant and Soil Sciences, Mississippi State University, Mississippi State, MS Results Introduction • Figure 1 shows observed and simulated plant height and number of bolls and mainstemnodes of the cultivar, DP555BG/RR with 150 lb/acre nitrogen. • Plots between simulated and observed measurements show very close match. • Model also predicted dates of occurrences of major phenological stages such as dates of first square, first bloom, and first open boll within the acceptable limits (±4 d). • The model simulations with appropriate variety parameters also simulated well for various management practices such as PIX, N and irrigations (Fig. 1 and 2). • Model prediction statistics, the coefficient of determination between simulated and observed yield ranged from 0.32 to 0.99 (Table 2). • Observed and model predicted yield of cultivar Paymaster 1218/BR is shown in Fig. 3 under two different soil types and five different N management options. • The cotton (Gossypiumhirsutum L.), an important fiber crop, is grown under a wide range of environmental conditions and management options throughout the world. • Recently, use of genetically modified (GM) cultivars of cotton has increased globally and in USA. In the year 2010, GM cultivars accounted 93% of cotton planted in the USA (Agril. Statistics Board, 2010). • Timely application of fertilizers, irrigation and plant growth regulators is essential for maximizing cotton yield for given weather condition scenario. • Cotton simulation, GOSSYM, has the capacity to simulate crop growth, development and final yield under a wide range of environmental, soil and management conditions for most cotton cultivars. • The GOSSYM model is being used both in management and also in policy arena for resource management. • The cotton simulation model GOSSYM was setup using input data prevailing during the time of the field experiment and the model was run several times to develop variety parameters. • Calibration was carried out by following the methodology discussed by Boone et al. (1993). • After estimating variety file parameters, model was run and simulated and observed plant growth indicators were compared statistically and graphically. Table 1: Cultivars used and treatment applied in study Objectives Fig. 1: Observed vs. simulated plant growth parameters of cultivar, DP555BG/R, grown with 150 lb/acre N • The GOSSYM model requires a cultivar parameter (variety) file to simulate each cultivar. This variety file contains information related to the growth and developmental characteristics of the cultivar. At present there are no variety files representing GM cultivars in GOSSYM database. Therefore present study was conducted with following objectives: • To develop cultivar-specific coefficients for six GM cotton cultivars grown in US Cotton Belt. • To evaluate the performance of cotton simulation model GOSSYM to simulate the growth, development and yield of GM cultivars. Summary and Conclusions • This is the first attempt to identify parameters for GM cultivars and to simulate GM cultivars using the GOSSYM model. The model simulated growth and developmental traits of GM cultivars fairly well. • The study shows that performance of GM cultivars were simulated without changing the shape of the response functions. This indicates that genetic modification in GM cultivars does not have any impact on the response shapes of the functions such as canopy photosynthesis, leaf expansion, response to fertilizers and the growth regulators, etc., except for the magnitude. • The new GM cultivar parameter files developed in this study will be useful for the model users who are currently using GOSSYM for natural resource management as an on-farm decision aid and in climate change studies. Fig. 2: Observed and model simulations cultivar, Nucotton33B with various management practices. Materials and Methods Several experiments were conducted on six GM cultivars grown on two different soil types with varying nitrogen (N), and plant growth regulator, PIX, and irrigation at the R.R. Foil Plant Science Research Center, Mississippi State University, Mississippi. Treatment details are presented in Table 1. Four N (0, 50, 100 and 150 lb/acre), and four-PIX (0. 8, 16 and 32 oz/acre) and two irrigation (irrigated and rain-fed) treatments were imposed during the growing season during two different years. Plants were irrigated on a regular intervals except for water stressed (WS) study where no irrigation was applied. Also, 150 lb/acre N was applied on all treatments except N as the treatment variable. In each experiment, plant height, mainstem nodes, squares, bolls and biomass of various plant parts were measured several times during the season. Table 2: Fit between observed and model simulated yield. Fig. 3: Observed vs. simulated yield of the cultivar, Paymaster1218/BR References • Boone, M.Y.L., Porter, D.O. and McKinion, J.M. (1993). Calibration of GOSSYM: Theory and practice. Computers and electronics in agriculture, 9: 193-203. • Agricultural Statistics Board (2010). Acreage. National Agricultural Statistics Service.