Download
1 / 24
240 likes | 393 Vues
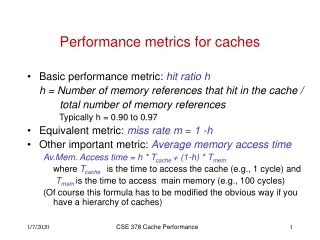
Performance metrics and configuration strategies for group network communication. Tom Z. J. FU Dah Ming Chiu John C. S. Lui. Outline. Motivation GMOS Leader Selection Strategy Two-step Mapping Method Experiment setup and results Applications and Conclusion. Motivation.

E N D
Performance metrics and configuration strategies for group network communication Tom Z. J. FU Dah Ming Chiu John C. S. Lui
Outline • Motivation • GMOS • Leader Selection Strategy • Two-step Mapping Method • Experiment setup and results • Applications and Conclusion
Motivation 1.Existing methods are designed for two-party communication. 2.Number of group-based multimedia applications is increasing. 3.Need appropriate metrics to evaluate QoS of group multimedia session. 4.Help select the proper strategy to distribute streams or mixed data to provide better QoS.
Group Mean Opinion Score GMOS metric evaluates the overall quality of the multi-party multimedia session. A MOSA B U MOSB GMOS C GMOS = f (MOSA, MOSB, MOSC) MOSC
Group Mean Opinion Score Define:
GMOS The range and meaning of GMOS:
GMOS experiment results We invite subjects to do experiments and find the distribution of parameter α. 1. 25 subjects are invited 2. 18 conference records 3. Subject gives two kinds of scores 4. 437 MOSes and GMOS pairs 5. 392α are determined
GMOS experiment results Observations from the results: 1. Those with α∈ (0, 1] focus more on the good condition 2. Those with α∈ [-1, 0) focus more on the bad condition 3. About 10% of the GMOS are either smaller than the MIN or larger than the MAX 4. From the figure, about 50% α∈ [-0.2, 0.2], so we set the default value of α to be 0 5. From the figure, the average value of all the 392 α is 0.093. Statistically, these subjects are “optimistic” on average. 6. This value is application dependent.
Leader Selection Strategy Several types of topologies supporting multi-party voice conference We will mainly focus on the “end system mixing” topology 1. Simplest topology 2. Bandwidth saving 3. No dedicated server 4. Effective and suitable
Leader Selection Strategy For simplicity, we need to make an assumption: The leader’s GMOSL will represent all participants’ opinion on evaluating the overall quality of the whole voice conference. 1. GMOS of each participant 2. GMOSL and GMOSM 3. N GMOSL : (GMOSL1, …, GMOSLN) 4. Leader with MAX(GMOSLi)
Leader Selection Strategy Problem: 1. Asking participants to provide GMOS on the overall QoS is a subjective test. 2. It is impossible to obtain subjective GMOS before or during the voice session. But we need to select the suitable conference leader before the voice session starts. => we need to estimate the GMOS
Two-Step Mapping Method We know how to estimate MOS from measurable network parameters: e.g. packet loss rate and end-to-end delay Loss rate Ie,eff E-Model R-value Estimated MOS Delay Id R = 93.2 – Ie,eff – Id
Two-Step Mapping Method Estimated GMOS.
The first step of TSMM Ie is codec dependent. From the Skype measurement paper, Skype uses iLBC codec as its audio codec. Random loss model Ppl[%] = ppl * 100%, where ppl is packet loss rate
The first step of TSMM 2-state Markov loss model: Not use because of rare occurrence BurstR < 1 BurstR = 1 (Random loss) BurstR > 1 (Bursty loss)
The first step of TSMM Id could be calculated: For G.107 codec No existing model and we are not certain whether it works well or not. Then we can obtain R-value through E-Model:
The second step of TSMM Apply the estimated MOSes derived in the first step and the GMOS model to get estimated GMOS. α= 0.093 is the average value of 392 samples obtained from our experiments α= 0 is the default value.
Experiment setup and results The second part of the experiments SKYPE (Ver 2.5) Ethereal (Ver 0.99) Audition (Ver 1.5) # of computers Location Accessing Internet 3 Shanghai ADSL 1 SJTU Campus LAN 1 CUHK Campus LAN
Experiment setup and results The second part of the experiments Through packet trace, we can obtain: • Bit rate, • Jitter, • Loss rate (random loss), • Loss rate and state transfer Prob. (2-state Markov loss model) Organize participants change leader in turn to finish group of experiments.
Experiment setup and results Mapping from estimated GMOS to subjective GMOS
Experiment setup and results Data results of the second part of the experiments Data with “*” is the largest GMOS value in each group, which means the one it belongs to should be the conference leader.
Applications A) Different kinds of metrics like USI. B) Try test data to select the proper leader. C) It could be an indicator. D) Choose a leader candidate if necessary.
Conclusion A) Proposal of GMOS B) Method to estimate GMOS C) Leader selection strategy D) Experimental validation
Q & A Thanks !