Download
1 / 17
170 likes | 314 Vues
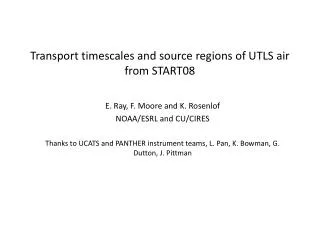
HIRDLS Observations of the Extra-Tropical UTLS and NRT Data During START08. John Gille University of Colorado and NCAR START08/Pre HIPPO Workshop 9 January 2008. 80km. 60km. 40km. 20km. 0 km. High Resolution Dynamics Limb Sounder (HIRDLS) Experiment.

E N D
HIRDLS Observations ofthe Extra-Tropical UTLS and NRT Data During START08 John Gille University of Colorado and NCAR START08/Pre HIPPO Workshop 9 January 2008
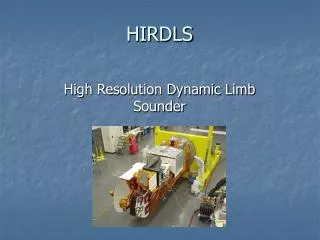
80km 60km 40km 20km 0 km High Resolution Dynamics Limb Sounder (HIRDLS) Experiment A 21 channel infrared limb scanner, selected for its ability to: • Sound the tropopause region, • Get high vertical resolution • Measure temperature, H2O, O3, NO2, CH4, N2O, HNO3, ClONO2, F11, F12, N2O5 • Cirrus, PSC’s and aerosol heights, amounts and characteristics Upper limits for T and O3 nominal- may be extended to ≥ 90 km in future O3 CH4 CFC11 Aerosol HNO3 NO2 T/p H2O N2O CFC12 ClONO2 N2O5 (Red- Presently available species) Significant advances - Optically thin channels to sound tropopause region Capability for high vertical resolution (≤ 1 km) Capability for high horizontal resolution (≤ 400 x 500 km) Long life (> 5 years)
HIRDLS Averaging Kernels & Resolution 46°N, 15 Jan 2007 • Detectors subtend about 1.2 km vertically at the limb, sampled every 200 m. • With low noise, permits high vertical resolution. • Data reported every 0.67 km, ~ 10% in pres. START08, 1/9/08
Summary of HIRDLS T and O3 evaluations ECMWF – HIRDLS, T, K Ozone difference between HIRDLS and ozonesondes (20+ sondes using 0.5% KI cathode solution) from the summer 2006 WAVES Campaign, sited in Beltsville, MD, 39N, 77W. Ozone differences are shown in terms of mixing ratio From Nardi et al., 2008. Comparison of HIRDLS temperatures with analyzed ECMWF temperatures interpolated to HIRDLS measurement locations. Mean and standard deviations of HIRDLS minus ECMWF temperature differences over full latitude range of HIRDLS measurements. From Gille et al., 2008.
High Vertical Resolution Ozone Measurements in the E. Pacific (Hilo)
HIRDLS Temperature, Ozone and Nitric Acid along Orbital Track in E. Pacific Note double tropopause Solid white lines-scaled Ertel PV. Dashed lines indicate u in m/s
Comparison Between HIRDLS and NCEP GFS Static Stability From Laura Pan
HIRDLS Along-track Ozone Cross- Section And GFS Static Stability Ozone GFS d/dz From Laura Pan
Along-track temperature and ozone fields for late January, 2006, showing evolution of transports between low latitude UT and mid-latitude LS Days from the top: January 20, 21, 23, 25, 26. HIRDLS T & O3 Cross-sections in the E. Pacific UT/LS Jan 20-26 2006
GEOS-5 Cross-sections of Temperature Potential Vorticity, and Ozone
HIRDLS SCAN TRACKS FOR1 DAY OVER U.S. Red- Ascending Orbit ~ 3 PM local time Blue- Descending Orbit ~ Midnight local time
HIRDLS Near-Real Time Data for START08 • In early stages of development • Technical Problems- timely acquisition of - S/C attitude and ephemeris data - Forecast GMAO data for LOS gradient calculations - HIRDLS L0 data • Solutions exist- need to be implemented & tested • Should be possible to automate, process orbit within a few hours of observations • Midnight-over Boulder, & West Coast, available following morning • Daytime passes - Possible coincidences with HIAPER flights
Conclusions- 1 • HIRDLS 1 km vertical x 1° latitude resolution allows detection of thin layers in the UT/LS • x/z = 102 ~ N/f gives dynamically consistent observations Shows double tropopause Poleward motion of UT tropical air (low ozone and HNO3), Equatorward motion of mid-latitude LS air (high ozone and HNO3) • Layers are consistent with contours of GEOS5 scaled Ertel PV • Locations of thin layer structures in the UT/LS can be found from column ozone maps of OMI and GEOS5, as well as GEOS5 and GFS temperature and PV maps
Conclusions -2 • GEOS5 PV & T analyses capture thin layer structures, while O3 analysis does not. • These layers almost certainly result in mixing, although more extensive study needed • Many questions remain. HIRDLS data will help to explore O3 and tracer transport/mixing in the UTLS region. • HIRDLS NRT data should aid in START08 flight planning. • HIRDLS data should provide important support to achieving START08 objectives.
Correspondence between GEOS-5 PV & Ozone Maps and Cross-Sections