Quantitative Analysis for Business
Quantitative Analysis for Business. Textbook: Render, B., Ralph, M.S.Jr., Hanna, M.E, Quantitative analysis for management , 9th edition, Prentice Hall, 2006 . Reference books: Hamdy A.Taha, Operations Research: An Introduction -7th edition, Prentice Hall, 2003.

Quantitative Analysis for Business
E N D
Presentation Transcript
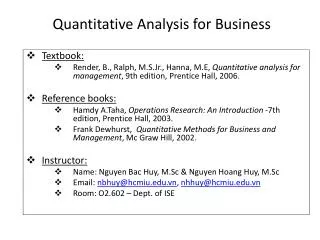
Quantitative Analysis for Business • Textbook: • Render, B., Ralph, M.S.Jr., Hanna, M.E, Quantitative analysis for management, 9th edition, Prentice Hall, 2006. • Reference books: • Hamdy A.Taha, Operations Research: An Introduction -7th edition, Prentice Hall, 2003. • Frank Dewhurst, Quantitative Methods for Business and Management, Mc Graw Hill, 2002. • Instructor: • Name: Nguyen Bac Huy, M.Sc & Nguyen Hoang Huy, M.Sc • Email: nbhuy@hcmiu.edu.vn, nhhuy@hcmiu.edu.vn • Room: O2.602 – Dept. of ISE
Quantitative Analysis for Business • Grading: • Midterm Exam: 30% • Final Exam: 40% • Project: 15% • Homework: 15% • Project Report Requirements: • Type written in A4 or letter size papers. • Executive Summary. • Statement of the problem. • Objectives of the Project. • Methodology • Results and Analysis • Recommendations and Conclusions • References and Appendix
Introduction to Quantitative Analysis Chapter 1
Learning Objectives • Describe the quantitative analysis approach • Understand the application of quantitative analysis in a real situation • Describe the use of modeling in quantitative analysis • Use computers and spreadsheet models to perform quantitative analysis • Discuss possible problems in using quantitative analysis • Perform a break-even analysis After completing this chapter, students will be able to:
Raw Data Quantitative Analysis Meaningful Information What is Quantitative Analysis? Quantitative analysis is a scientific approach to managerial decision making.
Examples in Decision Making • Selecting “best” alternatives based on some criteria • Top management in a company wants to expand their business by building a new factory. The potential alternating locations are A, B, C. The criteria they consider for establishing the factory are: minimize the total cost which includes transportation cost and investment cost. • Question: Which location will be the best choice?
Examples of Quantitative Analyses applied in some business • Taco Bell saved over $150 million using forecasting and scheduling quantitative analysis models • NBC television increased revenues by over $200 million by using quantitative analysis to develop better sales plans • Continental Airlines saved over $40 million using quantitative analysis models to quickly recover from weather delays and other disruptions
1. Defining the Problem 2. Developing a Model 3. Acquiring Input Data 4. Developing a Solution 5. Testing the Solution 6. Analyzing the Results 7. Implementing the Results The Quantitative Analysis Approach Figure 1.1
Defining the Problem Need to develop a clear and concise statement that gives direction and meaning to the following steps • This may be the most important and difficult step • It is essential to go beyond symptoms and identify true causes • May be necessary to concentrate on only a few of the problems – selecting the right problems is very important • Specific and measurable objectives may have to be developed
Y = b0 + b1X $ Sales $ Advertising Developing a Model Quantitative analysis models are realistic, solvable, and understandable mathematical representations of a situation
Developing a Model • Models generally contain variables (controllable and uncontrollable) and parameters • Controllable variables are generally the decision variables and are generally unknown • Parameters are known quantities that are a part of the problem
Garbage In Process Garbage Out Acquiring Input Data Input data must be accurate – GIGO rule Data may come from a variety of sources such as company reports, company documents, interviews, on-site direct measurement, or statistical sampling
Developing a Solution Common techniques are • Solving equations • Trial and error – trying various approaches and picking the best result • Complete enumeration – trying all possible values • Using an algorithm – a series of repeating steps to reach a solution
Testing the Solution Both input data and the model should be tested for accuracy before analysis and implementation • New data can be collected to test the model • Results should be logical, consistent, and represent the real situation
Analyzing the Results Determine the implications of the solution • Implementing results often requires change in an organization • The impact of actions or changes needs to be studied and understood before implementation Sensitivity analysis determines how much the results of the analysis will change if the model or input data changes • Sensitive models should be very thoroughly tested
Implementing the Results Implementation incorporates the solution into the company • Implementation can be very difficult • People can resist changes • Many quantitative analysis efforts have failed because a good, workable solution was not properly implemented Changes occur over time, so even successful implementations must be monitored to determine if modifications are necessary
Modeling in the Real World Quantitative analysis models are used extensively by real organizations to solve real problems • In the real world, quantitative analysis models can be complex, expensive, and difficult. • Following the steps in the process is an important component of success
How To Develop a Quantitative Analysis Model • An important part of the quantitative analysis approach • Let’s look at a simple mathematical model of profit Profit = Revenue – Expenses
How To Develop a Quantitative Analysis Model (cont.) Profit = Revenue – (Fixed cost + Variable cost) Profit = (Selling price per unit)(number of units sold) – [Fixed cost + (Variable costs per unit)(Number of units sold)] Profit = sX – [f+vX] Profit = sX – f –vX where s = selling price per unit v = variable cost per unit f = fixed cost X = number of units sold
Pritchett’s Precious Time Pieces The company buys, sells, and repairs old clocks. Rebuilt springs sell for $10 per unit. Fixed cost of equipment to build springs is $1,000. Variable cost for spring material is $5 per unit. Profits = sX – f – vX s = 10 f = 1,000 v = 5 Number of spring sets sold = X If sales = 0, profits = –$1,000 If sales = 1,000, profits = [(10)(1,000) – 1,000 – (5)(1,000)] = $4,000
f s – v X = Fixed cost (Selling price per unit) – (Variable cost per unit) BEP = Pritchett’s Precious Time Pieces Break-even point (BEP)-the number of units sold that will result in $0 profit. 0 = sX – f – vX, or 0 = (s – v)X – f Solving for X, we have f = (s – v)X
BEP for Pritchett’s Precious Time Pieces BEP = $1,000/($10 – $5) = 200 units Sales of less than 200 units of rebuilt springs will result in a loss Sales of over 200 units of rebuilt springs will result in a profit f s – v X = Fixed cost (Selling price per unit) – (Variable cost per unit) BEP = Pritchett’s Precious Time Pieces (cont.) Companies are often interested in their break-even point (BEP). The BEP is the number of units sold that will result in $0 profit. 0 = sX – f – vX, or 0 = (s – v)X – f Solving for X, we have f = (s – v)X
Advantages of Mathematical Modeling • Models can accurately represent reality • Models can help a decision maker formulate problems • Models can give us insight and information • Models can save time and money in decision making and problem solving • A model may be the only way to solve large or complex problems in a timely fashion • A model can be used to communicate problems and solutions to others
Models Categorized by Risk • Mathematical models that do not involve risk are called deterministic models • We know all the values used in the model with complete certainty • Mathematical models that involve risk, chance, or uncertainty are called probabilistic models • Values used in the model are estimates based on probabilities
Computers and Spreadsheet Models • QM for Windows • An easy to use decision support system • This is the main menu of quantitative models Program 1.1
Computers and Spreadsheet Models • Excel QM’s Main Menu (2003) • Works automatically within Excel spreadsheets Program 1.2A
Computers and Spreadsheet Models Excel QM’s Main Menu (2007) Program 1.2B
Computers and Spreadsheet Models Excel QM for the Break-Even Problem Program 1.3A
Computers and Spreadsheet Models Excel QM Solution to the Break-Even Problem Program 1.3B
Possible Problems in the Quantitative Analysis Approach Defining the problem • Problems are not easily identified • Conflicting viewpoints • Impact on other departments • Beginning assumptions • Solution outdated Developing a model • Fitting the textbook models • Understanding the model
Possible Problems in the Quantitative Analysis Approach Acquiring input data • Using accounting data • Validity of data Developing a solution • Hard-to-understand mathematics • Only one answer is limiting Testing the solution Analyzing the results
Implementation – Not Just the Final Step Lack of commitment and resistance to change • Management may fear the use of formal analysis processes will reduce their decision-making power • Action-oriented managers may want “quick and dirty” techniques • Management support and user involvement are important
Summary • Quantitative analysis is a scientific approach to decision making • The approach includes • Defining the problem • Acquiring input data • Developing a solution • Testing the solution • Analyzing the results • Implementing the results
Summary • Potential problems include • Conflicting viewpoints • The impact on other departments • Beginning assumptions • Outdated solutions • Fitting textbook models • Understanding the model • Acquiring good input data • Hard-to-understand mathematics • Obtaining only one answer • Testing the solution • Analyzing the results
Summary • Implementation is not the final step • Problems can occur because of • Lack of commitment to the approach • Resistance to change
Assignment: Quiz 01 1.14. Gina Fox has started her own company, Foxy Shirts, which manufactures imprinted shirts for special occasions. Since she has just begun this operation, she rent the equipment from a local printing shop when necessary. The cost of using the equipment is $350. The materials used in one shirt cost $8, and Gina can sell these for $15 each. • If Gina sells 20 shirts what will her total variables cost be? • How many shirts must Gina sell to break even? What is the total revenue for this ? • 1.15 Ray Bond sell handcrafted yard decoration at country fairs. The variable cost to make these is $20 each, and he sell them for $50. The cost to rent a booth at the fair is $150. How many of these must Ray sell to break even? • 1.16 Ray Bond from the problem 1.15 is trying to find a new supplier that will reduce his variable cost of production to $15 per unit. If he was able to succeed in reducing this cost, what would be the break even point be? • Homework 01 • 1.17-1.20 (page 19 text book) due next class.