Download
1 / 18
180 likes | 327 Vues
WHO measles mortality estimates, 2000-2009. Emily Simons Global Measles Management Meeting 17 March 2010. Overview. Background Brief description of method Provisional results Next steps. Background.

E N D
WHO measles mortality estimates, 2000-2009 Emily Simons Global Measles Management Meeting 17 March 2010
Overview • Background • Brief description of method • Provisional results • Next steps
Background • 3 progressively more refined models of measles mortality since 2000 Stein 2003, Wolfson 2007, Ferrari 2011 • 2011 model addresses QUIVER recommendations to incorporate: • surveillance data • dynamic transmission • herd immunity • objective definition for countries that have highly reliable surveillance data • Country consultation: letters sent to 119 countries
Overview of 2011 measles mortality estimation method • Annual country-specific cases estimated by method called state-space model • Cases distributed across age groups • Age, country, and year-specific CFRs applied to cases
State-space model • For each country independently, model compares two data for each year: a) reported cases and b) number of susceptibles based on susceptible-infected-recovered model • # of true cases estimated for year t, with random error added • Subtract these cases from susceptibles, repeat process for year t+1 • 1,000 iterations give distribution of most likely number of cases for time series
Age distribution • 172,191 line-listed cases from 102 countries • Outcome: age group • Explanatory variables: • GBD Region • MCV1 coverage Predicted age distribution of reported measles cases by MCV1 coverage level and region
Case fatality ratios • Age and country-specific CFRs from Wolfson IJE 2009 updated for new studies Nepal and India • Indexed to U5MR to reflect evidence of decline in deaths due to pneumonia, diarrhoea and malnutrition
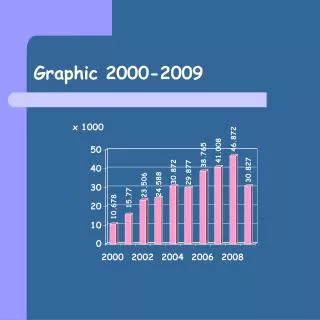
Provisional global estimated measles mortality and reported cases 74% global mortality reduction over 2000-2009
New model vs. Lancet model measles mortality estimates 79% 74%
Estimated measles deaths and reduction in mortality since 2000* 79% 87% 26% 82% *provisional
Next steps • Respond to feedback from country consultation • Many supportive responses, but some feel the data do not reflect their reality • Will modify input data, may modify structural features like herd immunity • Key challenge: how to identify when surveillance sensitivity has changed? • Clearance: required to fit within estimates of overall declining child mortality and estimated declines in other causes of child mortality • Challenge: non-V.P. diseases do not have annual surveillance/coverage data very different methods, with much greater lag time • Peer review
Measles mortality estimates, Eastern Mediterranean Region 96% 79%