Download
1 / 24
240 likes | 352 Vues
Monitoring Map. Default view: This is what the map looks like when you first arrive at the web page . Monitoring Map. Example Task 1: Find climate change data near Truro, Nova Scotia. Monitoring Map. Example Task 1: Find climate change data near Truro, Nova Scotia. First, click on

E N D
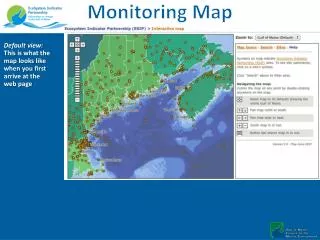
Monitoring Map Default view: This is what the map looks like when you first arrive at the web page
Monitoring Map Example Task 1: Find climate change data near Truro, Nova Scotia
Monitoring Map Example Task 1: Find climate change data near Truro, Nova Scotia First, click on Map layers to see how to display climate change sites on the map
Monitoring Map Example Task 1: Find climate change data near Truro, Nova Scotia
Monitoring Map Example Task 1: Find climate change data near Truro, Nova Scotia Map legend says orange symbols indicate sites with climate change data, which is what we are trying to find. So we don’t need to change map layers for Example Task 1.
Monitoring Map Example Task 1: Find climate change data near Truro, Nova Scotia To see the Truro area close up: • click on the Zoom to menu
Monitoring Map Example Task 1: Find climate change data near Truro, Nova Scotia To see the Truro area close up: • click on the Zoom to menu • select Saint John River in menu
Monitoring Map Example Task 1: Find climate change data near Truro, Nova Scotia Now the map shows a closer view of the St. John River and Bay of Fundy
Monitoring Map Example Task 1: Find climate change data near Truro, Nova Scotia Click [-] button once to zoom out slightly
Monitoring Map Example Task 1: Find climate change data near Truro, Nova Scotia Map shows a wider view of the Bay of Fundy
Monitoring Map Example Task 1: Find climate change data near Truro, Nova Scotia Click [–>] button to move map eastward toward Truro
Monitoring Map Example Task 1: Find climate change data near Truro, Nova Scotia
Monitoring Map Example Task 1: Find climate change data near Truro, Nova Scotia Click [–>] again to move map eastward toward Truro
Monitoring Map Example Task 1: Find climate change data near Truro, Nova Scotia Map now shows the Truro area
Monitoring Map Example Task 1: Find climate change data near Truro, Nova Scotia Choose one of the sites near Truro and click to see a Site Summary
Monitoring Map Example Task 1: Find climate change data near Truro, Nova Scotia Site Summary appears here
Monitoring Map Example Task 1: Find climate change data near Truro, Nova Scotia Click link for site detail
Monitoring Map Example Task 1: Find climate change data near Truro, Nova Scotia Site has climate change data Close-up map of the site Other nearby monitoring sites
Monitoring Map Example Task 2: Create a PDF map of monitoring sites for contaminants and eutrophication
Monitoring Map Example Task 2: Create a PDF map of monitoring sites for contaminants and eutrophication Click on Map layers
Monitoring Map Example Task 2: Create a PDF map of monitoring sites for contaminants and eutrophication Click on checkboxes for contaminants and eutrophication
Monitoring Map Example Task 2: Create a PDF map of monitoring sites for contaminants and eutrophication Click on Show/hide layers
Monitoring Map Example Task 2: Create a PDF map of monitoring sites for contaminants and eutrophication Click on Create PDF of Map
Monitoring Map Example Task 2: Create a PDF map of monitoring sites for contaminants and eutrophication A PDF version of the map is generated and can be downloaded for printing.