
WARM UP
WARM UP. Find the amplitude and period of the function and use the language of transformations to describe how the graph of the function is related to the graph of y = sin x. Remember: Amplitude = |a| Period = 2 π /|b|. What you’ll learn about. The Basic Waves Revisited

WARM UP
E N D
Presentation Transcript
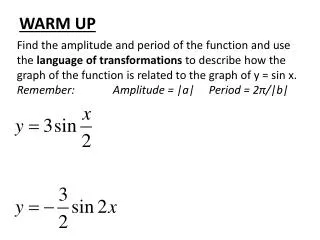
WARM UP Find the amplitude and period of the function and use the language of transformations to describe how the graph of the function is related to the graph of y = sin x. Remember: Amplitude = |a| Period = 2π/|b|
What you’ll learn about • The Basic Waves Revisited • Sinusoids and Transformations • Modeling Periodic Behavior with Sinusoids … and why Sine and cosine gain added significance when used to model waves and periodic behavior.
Sinusoid Period Amplitude
Sine and Cosine f(x) = sin x f(x) = cos x • Domain: All real numbers • Range: [-1, 1] • Continuous • Alternately increasing and decreasing in periodic waves • Bounded • Absolute maximum of 1; Absolute minimum of 1
Phase Shift Remember that the graph of y = f(x +c) is a translation of the graph of y = f(x) by c units to the left when c is positive (c is > 0) That is exactly what happens with sinusoids, and we say that the wave undergoes a of phase shift of –c.
Sin and Cos and Phase ShiftClass Work – Part 1 Graph f(x) = x2 and f(x) = (x + 1)2. What do you see? Graph f(x) = x3 and f(x) = (x –2)3. What do you see? Graph f(x) = sin x and f(x) = sin (x + 4). What do you see?
Sin and Cos and Phase ShiftClass Work – Part 2 Now, graph y = sin(x) in Y1 and y = cos(x) in Y2 What do you see in terms of a phase shift between sine and cosine? Look at the points where sin(x) has a maximum and cos(x) has a minimum (and vice versa) Can you write the cosine function as a phase shift of the sine function, and the sine function as a phase shift of the cosine function?
Frequency of a Sinusoid • The frequency is simply the reciprocal of the period. • Therefore, the frequency of a sinusoid is |b|/2π • Graphically, frequency is the number of complete cycles the wave completes in a unit interval
Visualizing a Musical Note • The musical note middle C can be modeled by: f(x) = 1.5 sin 524πx • Where x is the time in seconds • What is the amplitude of this function? • What is the period of this function? • What is the frequency of this function? (Frequency is 1/Period) • Graph the function with the graphing window: • Xmin = - 60; Xmax = 60 • Ymin = -4; Ymax = 4 • Xscl = π/2
Example: Finding the Frequency of a Sinusoid • Find the frequency of the function f(x) = 4 sin(2x/3) and interpret its meaning graphically. • The frequency is 2/3 2π = 1/(3 π) • This is the reciprocal of the period, which is 3π.
HOMEWORK P 393 #53 to 56 EXIT TICKET What is the phase shift between cos x and sin x?


