Download
1 / 21
220 likes | 322 Vues
Immunotheraphy for treating cancer. http://www.jimmunol.org/cgi/content/full/160/1/361. Cosmina S. Hogea University of Pennsylvania, SBIA Gregory J. Herring University of Massachusetts – Amherst, Dept. of Mathematics. http://bradley.bradley.edu/~sfan/research.html. Outline.

E N D
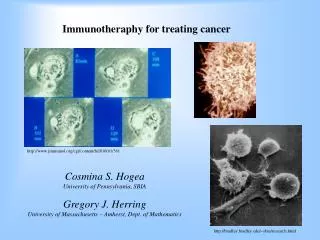
Immunotheraphy for treating cancer http://www.jimmunol.org/cgi/content/full/160/1/361 Cosmina S. Hogea University of Pennsylvania, SBIA Gregory J. Herring University of Massachusetts – Amherst, Dept. of Mathematics http://bradley.bradley.edu/~sfan/research.html
Outline • Description of the problem: - Biological overview - Mathematical modeling: simple mathematical model • Model analysis: analytic and numerical results in 1D • Conclusions and model extension
Malignant tumor growth – biological aspects Stages of evolution: Cellular stage Macroscopic stage: Avascular phase: tumor lacks its own network of blood vessels for nutrient supply; tumor obtains nutrient and “feeds” itself via diffusion processes alone with nutrient already existing in the environment; slow growth, limited by a quasi-steady-state tumor size (dormant tumors). Vascular phase: angiogenesis (i.e., the birth of new blood vessels) occurs; newly born blood vessels penetrate into the tumor mass, providing more nutrient; rapid growth of the tumor.
The immune system and cancer • Macrophages (monocytes): a type of white blood cells which scour the body • for anything out of place; they can engulf any foreign particles or eat tumor cells; • When a macrophage comes into contact with a cancerous cell, through its surface, they are signaled the cell is not healthy and macrophage should take a bite out of it; • Macrophage secrets enzymes able to digest the bite of tumor cell; • Further, most often, the macrophage transforms itself into a more specialized immune cell called a dendritic cell, which is found in all tissues of the body; • A fully mature dendritic cell is able to give the information about the tumor contained in the small digested packets to the rest of the immune system; • The matured dendritic cells migrate towards the lymph nodes, where it passes the tumor information to the cytotoxic T lymphocytes (CTLs), which become activated, divide and start hunting down cells with the same information as the original cancerous cell.
A simple mathematical model of macrophage infiltration • Simplifying biological modeling assumptions: - macrophages are frequently observed in solid tumors, predominantly in hypoxic regions; - under hypoxia, the tumor cells release chemoattractants to which macrophages are sensitive, giving rise to macrophage chemotaxis; - macrophages undergo a combination of random motion (diffusion) and chemotaxis, migrating into hypoxic tumor regions where they start destroying tumor cells. • Purpose of the modeling: understand/predict how macrophages migrate within solid tumors. Further: modeling treatment via genetically-engineered macrophages.
Remarks: Eq. (1): • quasi-steady-state mass conservation law for oxygen; • tumor consisting of only one phase (e.g. mostly water); • implicitly accounts for the potential existence of a necrotic region (where c c1). Eq. (2): • quasi-steady-state mass conservation law for chemoattractants; • implicitly accounts for the potential existence of a hypoxic/quiescent region (where c1 c c2) - where chemoattractants are being produced. • c1 and c2 are threshold oxygen concentration values. Eq. (4): • existence of a potential proliferative region(where c > c2); • tumor progression caused by the proliferating rim; • tumor regression caused by the macrophage activation in the hypoxic region. ! Avascular tumor model !
Typical profiles of the model independent variables in Case III (qss). Analytic and numerical solutions shown for comparison, marked as above. Impact of the oxygen threshold values c1 and c2 on the size of various rims inside a given-size avascular tumor. Larger avascular tumors generally exhibit a large necrotic core, an adjacent thinner quiescent rim and a very thin proliferative rim next to the tumor boundary.
Stabilization of tumor size R=R(t). Proliferation is dominant, bounded growth. Stabilization of tumor size R=R(t). Apoptosis is dominant, bounded shrinkage.
Stabilization of tumor size R = R(t) including quiescence (RQ = Xc1) and necrotic (RN=Xc2) regions.
Profiles of model state variables showing characteristic evolution in time with approach to steady-state.
Impact of macrophage action on tumor regression in time: various case scenarios. Note: according to this model, tumor can never be completely eradicated by macrophages. It can be analytically proved that the steady-state value of R(t) can never obey the bounds in Case I; Lowestpossible bound is:
Effect of hypoxia concentration value (c2) upon tumor steady-state size in the absence of macrophages. It can be shown that the steady state value of R(t) can never occur in Case I, however, the steady state value of R(t) can occur in both Case II and III.
Dependence of the stabilized tumor size R on the oxygen threshold value c2 (no macrophages):
Effect of gamma upon steady state tumor size. Although both cases show a significant reduction in tumor size, the simulation starting in Case III shows a larger reduction, moving the tumor size into Case II. Since the steady state tumor size cannot occur in Case I, the lesser reduction when starting in Case II is reasonable.
Conclusions: • Rigorously, the model should be formulated in spherical coordinates and solved under the spherical symmetry assumption to correctly simulate an avascular tumor spheroid (here it is being solved in 1D Cartesian coordinates, for simplicity); • Numerical solution in the 1D moving boundary case: front-fixing transformation, followed by a method of lines (2nd order spatial discretization) and a DAE solver; • Model shortcomings: - it is inherited a 1D model - the time-evolving tumor case can not be generalized to higher spatial dimensions; - it does not account for cell heterogeneity; - it does not account for the actual physical space occupied by the macrophages and its impact on the available tumor space; - it is greatly simplified to allow for ready analytic solutions.