Download
1 / 32
320 likes | 423 Vues
Learn about single sample tests, T-tests, ANOVA, post-hoc tests, and more in research statistical analyses. Improve your data analysis skills for better decision-making in research.

E N D
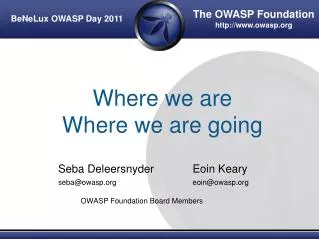
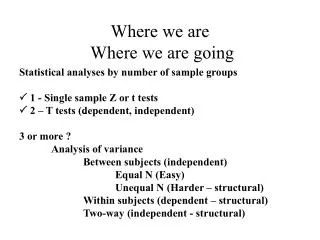
Where we are Where we are going Statistical analyses by number of sample groups 1 - Single sample Z or t tests 2 – T tests (dependent, independent) 3 or more ? Analysis of variance Between subjects (independent) Equal N (Easy) Unequal N (Harder – structural) Within subjects (dependent – structural) Two-way (independent - structural)
Analysis of VarianceEqual N (Easy) Used with 3 or more groups Extends logic of independent groups t-test Some additional things to think about
The alternative hypothesis in ANOVA is always - The population means are different (at least one mean is different from another) ASSUMPTIONS of ANOVA: equal variances (required for pooling) normality (required for test distribution) The null hypothesis in ANOVA is always: This implies that any combination of means are also equal
**** Null hypothesis is tested by comparing two estimates of the population variance (σ2): (MSB) between-group estimate of (σ2) AFFECTED by whether the null is true (MSW) within-group estimate of (σ2) UNAFFECTED by whether the null is true
ANOVA: Null Hypothesis Is TRUE Score Distributions Sample 3 Scores Sample 2 Scores Sample 1 Scores Mean Distributions, N=9 Sample 3 Mean Sample 2 Mean Sample 1 Mean
ANOVA: Null Hypothesis Is False Score Distributions Mean Distributions (N=9)
-- when the null hypothesis is true (MSB) F ratio = ------- = About 1 (MSw) -- when the null hypothesis is not true (MSB) F ratio = ------- = Much greater than 1 (MSw)
S2 Let: K = # of groups (treatments) J = a particular group 1…K NJ = # of people in group J _ Xj = Sample mean for group J NG = Total (grand) number of people _ XG = The grand mean I = Individual = Variance of the means
σ2 S2 S2 S2 Between Groups variance Is an estimate of Variance of the means σ2 σ2 --- Because the variance of the means is the n variance of the variable divided by sample size = (n) estimates the population variance (σ2 ) (n) = MSB IF groups are same size (n1=n2=n3…)
S2 S2 Between Groups variance If Null is true, then these are just random samples (n) estimates σ2 just as well as any random samples would If Null is false, then these are not just random samples (n) = MSB will be higher than the populations variance because the means are farther away from each other than would be expected by chance
S2 S2 pooled pooled Within Groups variance If Null is true, then these are just random samples So we can poll the variances just as we did with the independent samples t-test S12 + S22 + S32 +… Sk2 = ----------------------- k MSW = MSB F = --------- MSW
F Ratio • Critical values of f depend on dfW and dfB • Look up in table
Post-hoc tests ANOVA tells us there is some difference, but it does not tell us which groups are different from each other ANOVA is like a shotgun – firing many pellets at many different hypothesis like u1=u2 u2=u3 (u1+u2)/2=u3
Post-hoc tests - Tukey Tests all the pairwise comparisons – does not test complex hypotheses (such as (u1+u2)/2=u3) u1=u2 u1=u3 u1=u4 u2=u3 u2=u4 u3=u4
Apriori tests Also referred to as “planned comparisons” “planned contrast” A rifle instead of a shotgun. Used to test a specific hypothesis that is a subset of all hypotheses. For example, with 3 groups – if you wanted to test if group 3 was different from the other two groups, then you would test the following: (u1+u2)/2=u3
2 2 .
F Ratio • Critical values of f depend on dfW and dfB • Look up in table
S pooled Anova Effect size _ _ Xmax - Xmin dM = -------------- How far apart the means are divided by the standard deviation - Similar to the effect size for independent t-test (mean difference/stdev) Small Medium Large .2 .5 .8 =