Download
1 / 8
80 likes | 170 Vues
Explore enrichment levels and hierarchy in biological processes, cellular components, and molecular functions for MPG and GPG genes in pollen stages.

E N D
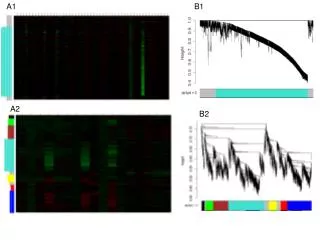
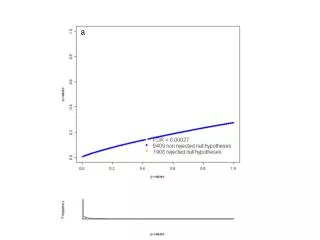
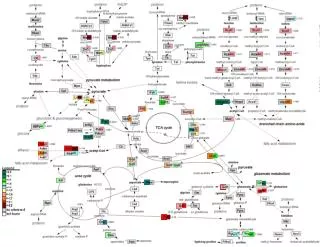
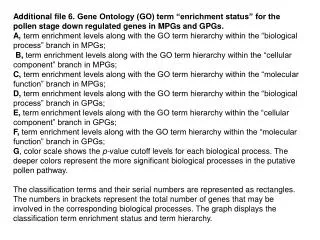
Additional file 6.Gene Ontology (GO) term “enrichment status” for the pollen stage down regulated genes in MPGs and GPGs. A, term enrichment levels along with the GO term hierarchy within the “biological process” branch in MPGs; B, term enrichment levels along with the GO term hierarchy within the “cellular component” branch in MPGs; C, term enrichment levels along with the GO term hierarchy within the “molecular function” branch in MPGs; D, term enrichment levels along with the GO term hierarchy within the “biological process” branch in GPGs; E, term enrichment levels along with the GO term hierarchy within the “cellular component” branch in GPGs; F, term enrichment levels along with the GO term hierarchy within the “molecular function” branch in GPGs; G, color scale shows the p-value cutoff levels for each biological process. The deeper colors represent the more significant biological processes in the putative pollen pathway. The classification terms and their serial numbers are represented as rectangles. The numbers in brackets represent the total number of genes that may be involved in the corresponding biological processes. The graph displays the classification term enrichment status and term hierarchy.
A, term enrichment levels along with the GO term hierarchy within the “biological process” branch in MPGs
B, term enrichment levels along with the GO term hierarchy within the “cellular component” branch in MPGs
C, term enrichment levels along with the GO term hierarchy within the “molecular function” branch in GPGs
D, term enrichment levels along with the GO term hierarchy within the “biological process” branch in GPGs
E, term enrichment levels along with the GO term hierarchy within the “cellular component” branch in GPGs
F, term enrichment levels along with the GO term hierarchy within the “molecular function” branch in GPGs
G, Color scale shows the p-value cutoff levels for each biological process. The deeper colors represent the more significant biological processes in the putative pollen pathway.