Download
1 / 1
10 likes | 162 Vues
CHARACTERISING THE TIME-COURSE OF MICROVASCULAR VASODILATOR RESPONSES USING LASER DOPPLER FLUXIMETRY AND IONTOPHORESIS. M. KLONIZAKIS (a), G. MANNING (b), R. DONNELLY (c). a ) School of Health and Social Care, University of Lincoln, Lincoln, UK,

E N D
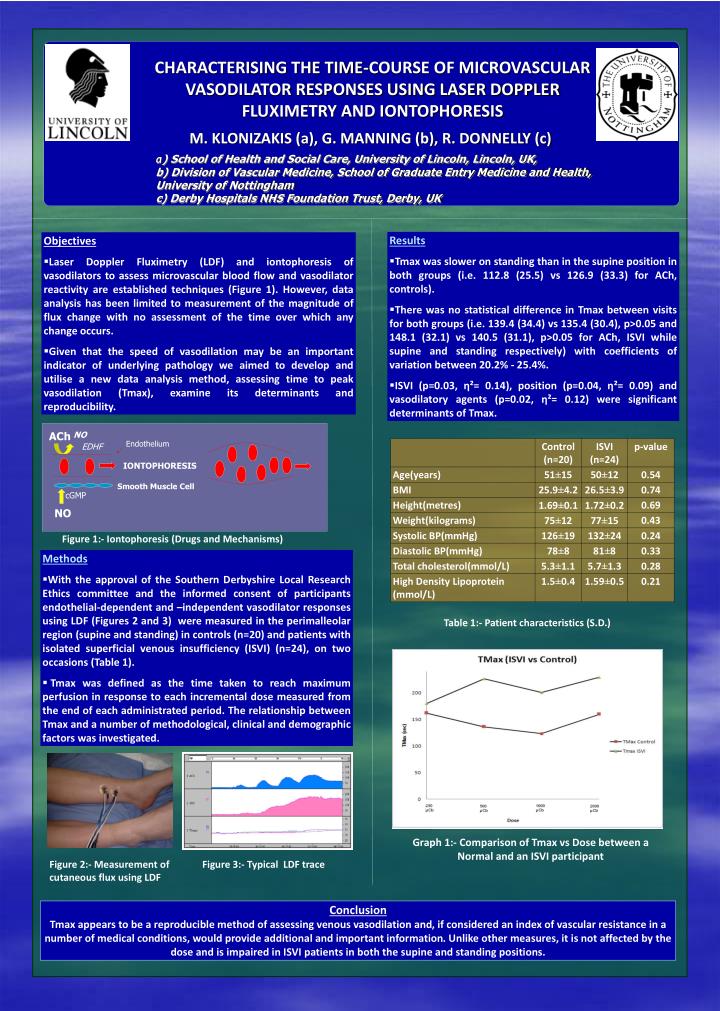
CHARACTERISING THE TIME-COURSE OF MICROVASCULAR VASODILATOR RESPONSES USING LASER DOPPLER FLUXIMETRY AND IONTOPHORESIS M. KLONIZAKIS (a), G. MANNING (b), R. DONNELLY (c) a) School of Health and Social Care, University of Lincoln, Lincoln, UK, b) Division of Vascular Medicine, School of Graduate Entry Medicine and Health, University of Nottingham c) Derby Hospitals NHS Foundation Trust, Derby, UK • Results • Tmax was slower on standing than in the supine position in both groups (i.e. 112.8 (25.5) vs 126.9 (33.3) for ACh, controls). • There was no statistical difference in Tmax between visits for both groups (i.e. 139.4 (34.4) vs 135.4 (30.4), p>0.05 and 148.1 (32.1) vs 140.5 (31.1), p>0.05 for ACh, ISVI while supine and standing respectively) with coefficients of variation between 20.2% - 25.4%. • ISVI (p=0.03, η²= 0.14), position (p=0.04, η²= 0.09) and vasodilatory agents (p=0.02, η²= 0.12) were significant determinants of Tmax. • Objectives • Laser Doppler Fluximetry (LDF) and iontophoresis of vasodilators to assess microvascular blood flow and vasodilator reactivity are established techniques (Figure 1). However, data analysis has been limited to measurement of the magnitude of flux change with no assessment of the time over which any change occurs. • Given that the speed of vasodilation may be an important indicator of underlying pathology we aimed to develop and utilise a new data analysis method, assessing time to peak vasodilation (Tmax), examine its determinants and reproducibility. ACh NO Endothelium EDHF IONTOPHORESIS Smooth Muscle Cell cGMP NO Figure 1:- Iontophoresis (Drugs and Mechanisms) • Methods • With the approval of the Southern Derbyshire Local Research Ethics committee and the informed consent of participants endothelial-dependent and –independent vasodilator responses using LDF (Figures 2 and 3) were measured in the perimalleolar region (supine and standing) in controls (n=20) and patients with isolated superficial venous insufficiency (ISVI) (n=24), on two occasions (Table 1). • Tmax was defined as the time taken to reach maximum perfusion in response to each incremental dose measured from the end of each administrated period. The relationship between Tmax and a number of methodological, clinical and demographic factors was investigated. Table 1:- Patient characteristics (S.D.) Graph 1:- Comparison of Tmax vs Dose between a Normal and an ISVI participant Figure 2:- Measurement of cutaneous flux using LDF Figure 3:- Typical LDF trace Conclusion Tmax appears to be a reproducible method of assessing venous vasodilation and, if considered an index of vascular resistance in a number of medical conditions, would provide additional and important information. Unlike other measures, it is not affected by the dose and is impaired in ISVI patients in both the supine and standing positions.