Download
1 / 41
410 likes | 612 Vues
V8 Systembiologie. Idee: Methoden der Systembiologie ermöglichen die integrierte, simultane Betrachtung möglichst vieler zellulären Prozesse wichtige Fragen: (1) wie soll man die Gesamtheit der metabolischen Reaktionen beschreiben?

E N D
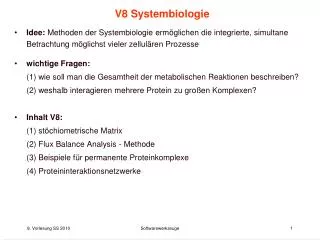
V8 Systembiologie • Idee: Methoden der Systembiologie ermöglichen die integrierte, simultane Betrachtung möglichst vieler zellulären Prozesse • wichtige Fragen: (1) wie soll man die Gesamtheit der metabolischen Reaktionen beschreiben? (2) weshalb interagieren mehrere Protein zu großen Komplexen? • Inhalt V8: (1) stöchiometrische Matrix (2) Flux Balance Analysis - Methode (3) Beispiele für permanente Proteinkomplexe (4) Proteininteraktionsnetzwerke
EcoCyc Database E.coli genome contains 4.7 million DNA bases. How can we characterize the functional complement of E.coli and according to what criteria can we compare the biochemical networks of two organisms? EcoCyc contains the metabolic map of E.coli defined as the set of all known pathways, reactions and enzymes of E.coli small-molecule metabolism. Analyze - the connectivity relationships of the metabolic network - its partitioning into pathways - enzyme activation and inhibition - repetition and multiplicity of elements such as enzymes, reactions, and substrates. Ouzonis, Karp, Genome Res. 10, 568 (2000) Bioinformatics III
EcoCyc Analysis of E.coli Metabolism E.coli genome contains 4391 predicted genes, of which 4288 code for proteins. 676 of these genes form 607 enzymes of E.coli small-molecule metabolism. Of those enzymes, 311 are protein complexes, 296 are monomers. Organization of protein complexes. Distribution of subunit counts for all EcoCyc protein complexes. The predominance of monomers, dimers, and tetramers is obvious Ouzonis, Karp, Genome Res. 10, 568 (2000) Bioinformatics III
Reactions EcoCyc describes 905 metabolic reactions that are catalyzed by E. coli. Of these reactions, 161 are not involved in small-molecule metabolism, e.g. they participate in macromolecule metabolism such as DNA replication and tRNA charging. Of the remaining 744 reactions, 569 have been assigned to at least one pathway. The next figures show an overview diagram of E. coli metabolism. Each node in the diagram represents a single metabolite whose chemical class is encoded by the shape of the node. Each blue line represents a single bioreaction. The white lines connect multiple occurrences of the same metabolite in the diagram. Ouzonis, Karp, Genome Res. 10, 568 (2000) Bioinformatics III
Reactions (A) This version of the overview shows all interconnections between occurren-ces of the same metabolite to communicate the complexity of the interconnections in the metabolic network. Ouzonis, Karp, Genome Res. 10, 568 (2000) Bioinformatics III
Reactions The number of reactions (744) and the number of enzymes (607) differ ... WHY?? (1) there is no one-to-one mapping between enzymes and reactions – some enzymes catalyze multiple reactions, and some reactions are catalyzed by multiple enzymes. (2) for some reactions known to be catalyzed by E.coli, the enzyme has not yet been identified. Ouzonis, Karp, Genome Res. 10, 568 (2000) Bioinformatics III
Assignment of EC numbers Of the 3399 reactions defined in the ENZYME database (version 22.0), 604 occur in E.coli. This means that the remaining 301 reactions of E.coli do not have assigned EC numbers. The number of EC class reactions present in E. coli against the total number of EC reaction types. The blue bars signify the percent contribution of each class for all known reactions in E. coli; the green bars signify the percent coverage of the EC classes in the known reactions in EcoCyc. Due to the apparently finer classification of classes 1-3, the two measures display an inverse relationship: More reactions in E. coli belong to classes 1-3, although they represent a smaller percentage of reactions listed in the EC hierarchy. Ouzonis, Karp, Genome Res. 10, 568 (2000) Bioinformatics III
Compounds The 744 reactions of E.coli small-molecule metabolism involve a total of 791 different substrates. On average, each reaction contains 4.0 substrates. Number of reactions containing varying numbers of substrates (reactants plus products). Ouzonis, Karp, Genome Res. 10, 568 (2000) Bioinformatics III
Compounds Each distinct substrate occurs in an average of 2.1 reactions. Ouzonis, Karp, Genome Res. 10, 568 (2000) Bioinformatics III
Pathways EcoCyc describes 131 pathways: energy metabolism nucleotide and amino acid biosynthesis secondary metabolism Pathways vary in length from a single reaction step to 16 steps with an average of 5.4 steps. Length distribution of EcoCyc pathways Ouzonis, Karp, Genome Res. 10, 568 (2000) Bioinformatics III
Pathways However, there is no precise biological definition of a pathway. The partitioning of the metabolic network into pathways (including the well-known examples of biochemical pathways) is somehow arbitrary. These decisions of course also affect the distribution of pathway lengths. Ouzonis, Karp, Genome Res. 10, 568 (2000) Bioinformatics III
Enzyme Modulation Ouzonis, Karp, Genome Res. 10, 568 (2000) Bioinformatics III
Reactions Catalyzed by More Than one Enzyme Diagram showing the number of reactions that are catalyzed by one or more enzymes. Most reactions are catalyzed by one enzyme, some by two, and very few by more than two enzymes. For 84 reactions, the corresponding enzyme is not yet encoded in EcoCyc. What may be the reasons for isozyme redundancy? (1) the enzymes that catalyze the same reaction are homologs and have duplicated (or were obtained by horizontal gene transfer), acquiring some specificity but retaining the same mechanism (divergence) (2) the reaction is easily „invented“; therefore, there is more than one protein family that is independently able to perform the catalysis (convergence). Ouzonis, Karp, Genome Res. 10, 568 (2000) Bioinformatics III
Enzymes that catalyze more than one reaction Genome predictions usually assign a single enzymatic function. However, E.coli is known to contain many multifunctional enzymes. Of the 607 E.coli enzymes, 100 are multifunctional, either having the same active site and different substrate specificities or different active sites. Number of enzymes that catalyze one or more reactions. Most enzymes catalyze one reaction; some are multifunctional. The enzymes that catalyze 7 and 9 reactions are purine nucleoside phosphorylase and nucleoside diphosphate kinase. Take-home message: The high proportion of multifunctional enzymes implies that the genome projects significantly underpredict multifunctional enzymes! Ouzonis, Karp, Genome Res. 10, 568 (2000) Bioinformatics III
Reactions participating in more than one pathway The 99 reactions belonging to multiple pathways appear to be the intersection points in the complex network of chemical processes in the cell. E.g. the reaction present in 6 pathways corresponds to the reaction catalyzed by malate dehydrogenase, a central enzyme in cellular metabolism. Ouzonis, Karp, Genome Res. 10, 568 (2000) Bioinformatics III
Flux balancing Any chemical reaction requires mass conservation. Therefore one may analyze metabolic systems by requiring mass conservation. Only required: knowledge about stoichiometry of metabolic pathways and metabolic demands For each metabolite: Under steady-state conditions, the mass balance constraints in a metabolic network can be represented mathematically by the matrix equation: S · v = 0 where the matrix S is the m n stoichiometric matrix, m = the number of metabolites and n = the number of reactions in the network. The vector v represents all fluxes in the metabolic network, including the internal fluxes, transport fluxes and the growth flux.
Flux balance analysis Since the number of metabolites is generally smaller than the number of reactions (m < n) the flux-balance equation is typically underdetermined. Therefore there are generally multiple feasible flux distributions that satisfy the mass balance constraints. The set of solutions are confined to the nullspace of matrix S. To find the „true“ biological flux in cells ( e.g. Heinzle, Volmer, UdS) one needs additional (experimental) information, or one may impose constraints on the magnitude of each individual metabolic flux. The intersection of the nullspace and the region defined by those linear inequalities defines a region in flux space = the feasible set of fluxes.
Feasible solution set for a metabolic reaction network (A) The steady-state operation of the metabolic network is restricted to the region within a cone, defined as the feasible set. The feasible set contains all flux vectors that satisfy the physicochemical constrains. Thus, the feasible set defines the capabilities of the metabolic network. All feasible metabolic flux distributions lie within the feasible set, and (B) in the limiting case, where all constraints on the metabolic network are known, such as the enzyme kinetics and gene regulation, the feasible set may be reduced to a single point. This single point must lie within the feasible set. Edwards & Palsson PNAS 97, 5528 (2000)
E.coli in silico + and – means growth or no growth. means that suppressor mutations have been observed that allow the mutant strain to grow. glc: glucose, gl: glycerol, succ: succinate, ac: acetate. In 68 of 79 cases, the prediction is consistent with exp. predictions. Red and yellow circles are the predicted mutants that eliminate or reduce growth. Edwards & Palsson PNAS 97, 5528 (2000)
Rerouting of metabolic fluxes (Black) Flux distribution for the wild-type. (Red) zwf- mutant. Biomass yield is 99% of wild-type result. (Blue) zwf- pnt- mutant. Biomass yield is 92% of wildtype result. The solid lines represent enzymes that are being used, with the corresponding flux value noted. Note how E.coli in silico circumvents removal of one critical reaction (red arrow) by increasing the flux through the alternative G6P P6P reaction. Edwards & Palsson PNAS 97, 5528 (2000)
Proteininteraktionsnetzwerke De Las Rivas, PLOS Comp Biol. 6, e1000807 (2010)
Proteininteraktionsnetzwerke De Las Rivas, PLOS Comp Biol. 6, e1000807 (2010)
Proteininteraktionsnetzwerke De Las Rivas, PLOS Comp Biol. 6, e1000807 (2010)
Proteininteraktionsnetzwerke De Las Rivas, PLOS Comp Biol. 6, e1000807 (2010)
Proteininteraktionsnetzwerke De Las Rivas, PLOS Comp Biol. 6, e1000807 (2010)