Download

1 / 18
180 likes | 373 Vues
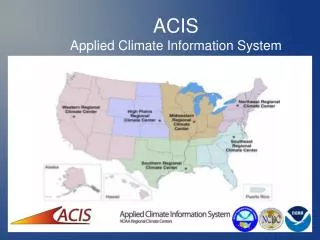
Keith Eggleston Northeast Regional Climate Center Cornell University. Regional Climate Centers ACIS Update. Partial incorporation of GHCN-Daily. ACIS Database Updates. Adding GHCN-Daily provides access to: CoCoRaHS CRN Canadian and Mexican data. Currently higher priority given to:

E N D
Keith Eggleston Northeast Regional Climate Center Cornell University Regional Climate CentersACIS Update
Partial incorporation of GHCN-Daily ACIS Database Updates • Adding GHCN-Daily provides access to: • CoCoRaHS • CRN • Canadian and Mexican data • Currently higher priority given to: • TD-3210 • Other TD-32xx data sets • Daily CF-6 statements
ACIS Web Services • Single station data access • Multi-station analyses • State, division, county, basin, CWA, bounding box • Station metadata • Gridded data • SC ACIS is built on ACIS Web Services • http://scacis.rcc-acis.org • Available from most programming languages • JavaScript, Python, Perl, PHP
ACIS Station Web Services http://data.rcc-acis.org/StnData?sid=KIAD&sdate=2010-02-04&edate=2010-02-08&elems=maxt,mint,pcpn,snow,snwd WASHINGTON DC DULLES AP 2010-02-04,40,27,0.00,0.0,2 2010-02-05,35,30,1.47,14.9,1 2010-02-06,32,10,1.98,17.5,18 2010-02-07,31,7,0.00,0.0,21 2010-02-08,32,13,0.00,0.0,20
ACIS Multi-Station Web Services curl http://data.rcc-acis.org/MultiStnData -d 'params={"climdiv":"FL01","date":"1985-1", "elems":[{"name":"mint", "interval":"mly", “duration":1, "reduce":"min"}]}' 082220,DE FUNIAK SPRINGS 1 E,FL,-86.093890,30.724440,245,3 12827,APALACHICOLA AP,FL,-85.033330,29.733330,19,9 93805,TALLAHASSEE RGNL AP,FL,-84.353330,30.393060,55,6 13899,PENSACOLA RGNL AP,FL,-87.186940,30.478060,112,5 089566,WEWAHITCHKA,FL,-85.204170,30.119170,42,12 086842,PANAMA CITY,FL,-85.660560,30.249170,5,6 083230,FOUNTAIN 3 SSE,FL,-85.416670,30.433330,140,4 085879,MONTICELLO WTP,FL,-83.783330,30.492220,98,4 086240,NICEVILLE,FL,-86.492780,30.531670,60,4 087429,QUINCY 3 SSW,FL,-84.583610,30.549720,245,4 93841,WHITING FLD NAS,FL,-87.016670,30.716670,199,5 081544,CHIPLEY,FL,-85.484720,30.783610,130,2 085793,MILTON EXP ST,FL,-87.141390,30.779440,217,3
Need for Access to Gridded Data • Applications requiring GIS layers. • Visualize GCM model output. • Answer questions like: • What has been the highest temperature in my county each summer over the last 30 years? • What was the average rainfall for a particular river basin last month?
GRID ACIS Goal • Allow easy access to a variety of existing gridded data sets. • Focus on standardized methods of data summarization and presentation, rather than creation of new gridded data sets.
GRID ACIS Web Services • Similar syntax to station and multi-station data calls. • Resultant capabilities, such as: • Area summaries • Graphic output
GRID ACIS – Single Grid Point • /StnData? sid=KIAD&sdate=2010-02-04&edate=2010-02-08&elems=maxt,mint,pcpn • /GridData?grid=3&loc=-77.46,38.94&sdate=2010-02-04&edate=2010-02-08&elems=maxt,mint,pcpn 2010-02-04, 40, 26, 0.02 2010-02-05, 40, 27, 0.00 2010-02-06, 36, 27, 1.63 2010-02-07, 29, 12, 0.75 2010-02-08, 32, 11, 0.00 • Differences • Call to GridData instead of StnData • Specify the grid of interest (3 = NRCC hi-res) • Specify location (longitude, latitude) instead of station id
GRID ACIS – Grid Data Output • /MultiStnData-d ‘params={”state":”CT”, "date":”2011-08”, "elems":[{"name":”pcpn", "interval":"mly", “duration":1, "reduce":”sum"}]}’ • /GridData -d ‘params={"grid":3,”state":"CT","date":"2011-08", "elems":[{"name":"pcpn","interval":"mly","duration":1,"reduce":"sum"}]}’ {"data": [["2011-08",[ [13.52,13.52,13.65,13.20,13.99,13.58,12.37,13.44,13.44,15.06,16.74,15.80,14.88,13.84,13.31,14.68,17.36,17.01,17.93,15.77,12.11,12.11,11.58,12.20,12.20,11.99,10.66,10.84,12.00,11.94,10.79,10.79,10.53,10.42,10.73,10.08,9.03,9.03,8.85,8.66,8.66,9.90,9.55,8.02,8.02,8.81,8.03,8.03,7.60], [14.59,14.38,15.13,14.94,15.90,15.27,15.27,14.06,13.41,13.71,14.35,12.77,12.77,13.18,14.75,14.86,16.72,17.89,16.89,16.89,14.39,11.89,11.89,12.12,12.46,11.73,11.73,10.79,11.85,11.85,11.05,10.67,10.47,11.23,12.11,12.11,10.72,10.00,10.00,10.17,9.95,10.17,10.17,10.19,9.63,9.63,8.92,7.79,8.70], … [15.20,15.82,14.83,12.95,12.95,10.97,11.29,11.78,12.48,11.21,11.11,10.50,11.54,11.54,12.10,12.26,12.26,12.04,12.27,12.00,12.00,11.07,11.47,11.47,10.24,9.94,9.72,9.72,10.02,10.02,9.88,11.12,11.12,11.73,11.82,11.28,12.57,14.20,13.67,13.67,14.02,14.02,12.92,13.11,13.63,13.63,14.51,14.25,14.25]]]]} • Differences • Call to GridData instead of MultiStnData • Specify the grid of interest
GRID ACIS – Area Reduction • County average precipitation params={"grid":3, ”state":"CT", "sdate":"2011-8", "edate":"2011-08", "elems":[{"name":"pcpn", "interval":"mly", "reduce":"sum", "area_reduce":"county_mean"}]} "2011-08",{ "09015": 12.91, "09007": 11.41, "09005": 13.01, "09011": 11.60, "09003": 12.64, "09013": 11.80, "09001": 13.26, "09009": 13.76 }
GRID ACIS – Image Output Request: params={"grid":1, ”state":"FL", “date":"1985-01" "elems":[{"name":"mint", "interval":”mly”, "duration”:1, "reduce":"min"}], "output":{"type":"png", "proj":"lcc", overlays":"state", "interp":"cspline", "cmap":"Blues", "width":350, "height":350, "levels":[12,17,22,27,32,37]}} JSON return: {"cmap": ["#f7fbff", "#d6e5f4", "#abcfe5", "#6baed6", "#3787c0", "#105ba4", "#08306b"], "range": [-1.038178920745, 48.7273368835], "levels":[12.0, 17.0, 22.0, 27.0, 32.0, 37.0], "data": "data:image/png;base64, ...", "size": [350, 350]}
GRID ACIS – Area Reduction • Average Annual Number of Days ≥ 95° params={"grid":1, ”state":"FL", ”sdate":"1980-12", "edate":"2010-12", "elems":[{"name":"maxt","interval":[1,0],"duration":12, "reduce":"cnt_ge_95", "area_reduce":"climdiv_mean", "smry":"mean"}]} {"data":[ ["1980-12",{"FL02": 21.6, "FL03": 12.7, "FL01": 27.1, "FL06": 7.3, "FL07": 0.9, "FL04": 14.1, "FL05": 10.3}], ["1981-12",{"FL02": 30.2, "FL03": 23.9, "FL01": 23.9, "FL06": 6.4, "FL07": 1.7, "FL04": 22.3, "FL05": 17.8}], ["1982-12",{"FL02": 7.2, "FL03": 1.4, "FL01": 7.0, "FL06": 1.4, "FL07": 0.2, "FL04": 1.8, "FL05": 1.8}], ["1983-12",{"FL02": 19.7, "FL03": 9.3, "FL01": 16.6, "FL06": 4.4, "FL07": 2.0, "FL04": 7.5, "FL05": 5.0}], ... ["2007-12",{"FL02": 17.8, "FL03": 12.4, "FL01": 25.1, "FL06": 1.3, "FL07": 2.5, "FL04": 11.3, "FL05": 10.8}], ["2008-12",{"FL02": 6.6, "FL03": 5.1, "FL01": 6.6, "FL06": 1.0, "FL07": 1.1, "FL04": 3.8, "FL05": 3.6}], ["2009-12",{"FL02": 8.2, "FL03": 9.8, "FL01": 14.0, "FL06": 2.4, "FL07": 1.5, "FL04": 10.4, "FL05": 13.4}], ["2010-12",{"FL02": 8.2, "FL03": 9.8, "FL01": 14.0, "FL06": 2.4, "FL07": 1.5, "FL04": 10.4, "FL05": 13.4}]], "smry":[ {"FL02": 13.3, "FL03": 9.1, "FL01": 12.8, "FL06": 2.0, "FL07": 0.8, "FL04": 8.4, "FL05": 8.1}]}
Grid ACIS – Data Sets • ACIS interpolated temperature and precip (1970-2010) • Bias-adjusted temperature (east of Rockies) • DeGaetano, A.T. and B.N. Belcher, 2007: Spatial Interpolation of Daily Maximum and Minimum Air Temperature Based on Meteorological Model Analyses and Independent Observations, J. Applied Meteorology and Climatology, 46, 1981–1992. • Radar-guided precipitation estimates (east of Rockies) • DeGaetano, A.T. and D.S. Wilks, 2009: Radar-guided interpolation of climatological precipitation data, International Journal of Climatology, 29, 185-196. • NARCCAP (North American Regional Climate Change Assessment Program)
ACIS Web Services Training • Series of six webinars • Available on YouTube (search “NRCCACIS”) • Workshop • ACIS Developers Workshop • August 7-9 at Cornell University • Spots still available • http://data.rcc-acis.org • Query Builder tool • http://scacis.rcc-acis.org/ACIS_Builder.html
ACIS Query Builder • http://scacis.rcc-acis.org/ACIS_Builder.html