Download

1 / 6
60 likes | 85 Vues
Statistics for bankruptcies and bankruptcy filing rates. <br>This statistic shows the number of business bankruptcy cases filed in 1996 - 2020 .

E N D
Contents The RAND Corporation is a research organization that develops solutions to public policy challenges to help make communities throughout the world safer and more secure, healthier and more prosperous.
Business Bankruptcy Statistics for bankruptcies and bankruptcy filing rates. This statistic shows the number of business bankruptcy cases filed in 1996 - 2020.
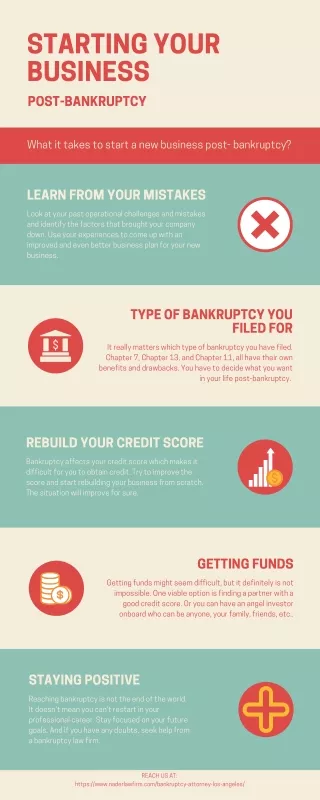
Bankruptcy Filings Fall In Second Quarter of 2020 Highest in South RAND State Statistics recently updated its Bankruptcy and Bankruptcy database from 1996 to the second quarter (Q2) of 2020. Here are some highlights from the last 18 months.
Bankruptcy Rates Vary Across States The highest bankruptcy rates were concentrated in the South, in Alabama (5.2%), Tennessee (4.4%), and Mississippi (4.0%). Shows the states with the lowest rates of total bankruptcy filings in the second quarter of 2020.