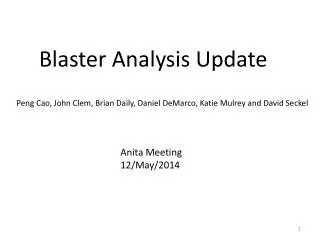
Blaster Analysis Update
This report discusses Blaster events as defined by specific criteria related to peak voltage and Nadir ring measurements. It presents a comprehensive analysis of over 50 Blaster events flagged in the ANITA data, highlighting the removal of hot periods due to ground sources interference. A preliminary histogram illustrates the correlation between spin rate and payload orientation concerning solar position. Observations indicate that Blaster events are more frequent when the ANITA instrument faces the sun, suggesting a potential relationship with solar UV exposure. Future work will focus on isolating angle-spin bands for detailed pattern analysis.

Blaster Analysis Update
E N D
Presentation Transcript
Blaster Analysis Update Peng Cao, John Clem, Brian Daily, Daniel DeMarco, Katie Mulrey and David Seckel Anita Meeting 12/May/2014
Blaster Definition: events with at least 15 channels or 9 phi sectors with a peak voltage in either polarization > 400 mV. Nadir Definition: Events where the peak voltage in the top ring is less than half of the peak voltage in the nadir ring. Blaster Event Example
The Hot Periods are removed from the analysis as they appear to correlated with ground sources
ftp://ftp.bartol.udel.edu/clem/anita/presentation/ PNG Screen shots ~50 different Blaster Events GIF of all screen shots ftp://ftp.bartol.udel.edu/clem/anita/presentation/blastwf.gif
Polar version of the angular histogram shown in previous slide Preliminary
Histogram of Payload Spin Rate, Gray all GPS Data, Red Good Blaster Events Both histograms are scaled for viewing purposes
Correlation of Spin Rate versus Payload Orientation WRT the SUN Gray: all GPS Data, Red: Good Blaster Events Spin Rate (degrees/second)
Summary The correlation of Blaster events with Solar UV is not observable Blaster events are more frequent when the back of the ANITA instrument faces the sun and the payload spin rate is greater than 0.1 deg/sec or less than -0.1 deg/sec. Generally the horns in the vicinity of the ANITA instrument form the BlasterEvents. Next step is to isolate angle-spin bands and look for possible different horn patterns in the events.