SEM
2 SEMs & 2 SICs closed to the Dumps. 1 SIC, 1 Faraday cup & 1 SEM. SEM. SIC. F. cup. SEM. SIC. SIC. SEM. 4 similar set-ups : Girder 6,7,11 and 13. 4 th – 8 th October 2004 tests. RAW signal ( no amplifier or electronics – just cable to digitizer )

SEM
E N D
Presentation Transcript
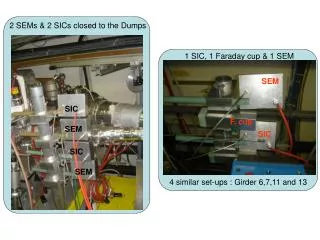
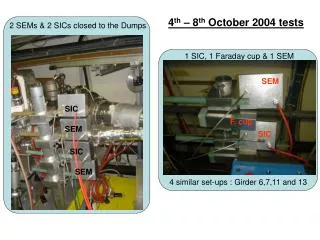
2 SEMs & 2 SICs closed to the Dumps 1 SIC, 1 Faraday cup & 1 SEM SEM SIC F. cup SEM SIC SIC SEM 4 similar set-ups : Girder 6,7,11 and 13 4th – 8th October 2004 tests
RAW signal (no amplifier or electronics – just cable to digitizer) Voltage Dependence on SICvisible: Signal on the decay side for the SIC at different voltages, give correct sign dependence. • Keeping the beam loss constant, the signal increases with applied voltage • average of 5 measurements at each voltage • We can see the rise time (~30ns) and the decay time (~120ns) (to be checked with a fit)
Voltage Scan of Chambers at Girder 7 with the electronics (50ohm resistor to an amplifier) 1. SIC voltage scan Dominated by a signal that is not ionization, since when changing the voltage, the signal does not move in the correct direction. Estimate 1 mA/cm2 of current from the beam going through the chambers. This is a high beam loss region.
The SEM gives the same result as the SIC Data taken at the same time, same beam conditions. Same z position. Just the mounting position in x different Thibaut please check – is this in x? Hence the SEM seems to be collecting noise, by a mechanism similar to the SIC 2. SEM voltage scan
Intensity Scan for Faraday cup, SIC and SEM: The signal of the faraday cup and the chambers are correlated The faraday cup seems to give a signal more than the SIC and the SEM, and proportional to the difference between the area of the signal collectors: Area of collectors: SIC 2cm2 and the Faraday cup 16 cm2
Conclusions: • SIC is functioning as an ion ionization chamber – since we see the voltage dependence • SIC and SEM are dominated by noise • There is noise both when the Chambers are connected to the resistor and Amplifier, and when they are connected directly to the digitizer • Intensity scan – the chambers increase in signal, proportional to the faraday cup, but full intensity scan must still be completed. • TO DO • Find the source of the noise (cable pick-up to the amplifier, or to the digitizer) • Only then we can study the timing response, to see if it is suitable for a few nanosecond real time response