Download
1 / 26
260 likes | 428 Vues
Sistema Universitario Ana G. Méndez División de Capacitación Basic Quality Tools. CQIA Primer Section VII Sr. Israel Rodríguez, CQIA. http://www.asq.org/learn-about-quality/seven-basic-quality-tools/overview/overview.html. Problem Solving Steps. Identify the problem Define the problem

E N D
Sistema Universitario Ana G. MéndezDivisión de CapacitaciónBasic Quality Tools CQIA Primer Section VII Sr. Israel Rodríguez, CQIA http://www.asq.org/learn-about-quality/seven-basic-quality-tools/overview/overview.html
Problem Solving Steps • Identify the problem • Define the problem • Investigate the problem • Analyze the problem • Solve the problem • Confirm the results http://www.asq.org/learn-about-quality/problem-solving/overview/overview.html
Data Types • Attribute data (Counted data) • Answers the questions of “how many” or “how often” • Describe discrete data • Variable data (Measurable data) • Answers the questions “how long”, “what volume”, “how much time”, or “how far” • Describe continuous data • Locational data • Answers the questions “where”
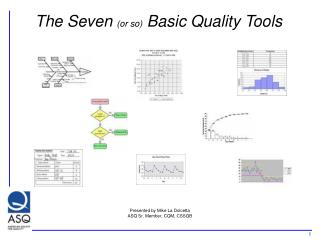
Quality Tools • Tools used to define and analyze discrete processes that usually produce quantitative data: • Flowchart • Cause-and-effect diagram • Pareto chart • Check sheet • Run/control chart • Histogram • Scatter diagram Source: Organize your Quality Toolbelt, www.asq.org
Quality Tools • Quality tools are primarily used to understand, analyze and improve processes. • “Using the right tool for the right application is critical.” Source: Organize your Quality Toolbelt, www.asq.org
Quality Tools Used primarily to help understand the process, to identify potential causes for process performance problems, and to collect and display data indicating which causes are most prevalent. Flowchart Cause-and-effect diagram Pareto chart Check sheet Source: Organize your Quality Toolbelt, www.asq.org
Quality Tools • Flowchart/process map • Graphical tool for process understanding • A flowchart creates a graphical representation of the steps in a process • A process map adds lists of inputs and outputs for each step http://www.asq.org/learn-about-quality/process-analysis-tools/overview/flowchart.html
Quality Tools • Cause-effect diagram • A tool for analyzing process dispersion • It is also referred to as the "Ishikawa diagram," because Kaoru Ishikawa developed it, and the "fishbone diagram," because the complete diagram resembles a fish skeleton • The diagram illustrates the main causes and subcauses leading to an effect symptom) http://www.asq.org/learn-about-quality/cause-analysis-tools/overview/fishbone.html
Quality Tools • Pareto chart • A graphical tool for ranking causes from most significant to least significant. • It is based on the Pareto principle, first defined by J. M. Juran in 1950. • The principle, named after 19th-century economist Vilfredo Pareto, suggests that most effects come from relatively few causes; that is, 80% of the effects come from 20% of the possible causes. http://www.asq.org/learn-about-quality/cause-analysis-tools/overview/pareto.html
Quality Tools • Check sheet • A simple data-recording device • The check sheet is custom-designed by the user, which allows him or her to interpret the results easily http://www.asq.org/learn-about-quality/data-collection-analysis-tools/overview/check-sheet.html
Quality Tools • Used for more precise data analysis. • They can help you identify trends, distribution and relationships. Run/control chart Histogram Scatter diagram Source: Organize your Quality Toolbelt, www.asq.org
Quality Tools • Histogram • A graphic summary of variation in a set of data • The pictorial nature of the histogram lets people see patterns that are difficult to detect in a simple table of numbers http://www.asq.org/learn-about-quality/data-collection-analysis-tools/overview/histogram.html
Quality Tools • Control chart • A chart with upper and lower control limits on which values of some statistical measure for a series of samples or subgroups are plotted. • The chart frequently shows a central line to help detect a trend of plotted values toward either control limit. http://www.asq.org/learn-about-quality/data-collection-analysis-tools/overview/control-chart.html
Quality Tools • Scatter diagrams • A graphical technique to analyze the relationship between two variables. • Two sets of data are plotted on a graph, with the y-axis being used for the variable to be predicted and the x-axis being used for the variable to make the prediction. • The graph will show possible relationships among variables. http://www.asq.org/learn-about-quality/cause-analysis-tools/overview/scatter.html
Scatter Diagram Curva francesa