User-Centric Visual Analytics
User-Centric Visual Analytics. Remco Chang Tufts University Department of Computer Science. Human + Computer. Human vs. Artificial Intelligence Garry Kasparov vs. Deep Blue (1997) Computer takes a “brute force” approach without analysis


User-Centric Visual Analytics
E N D
Presentation Transcript
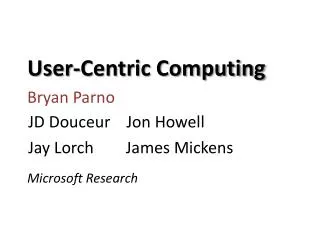
User-Centric Visual Analytics Remco Chang Tufts University Department of Computer Science
Human + Computer • Human vs. Artificial Intelligence Garry Kasparov vs. Deep Blue (1997) • Computer takes a “brute force” approach without analysis • “As for how many moves ahead a grandmaster sees,” Kasparov concludes: “Just one, the best one” • Artificial vs. Augmented Intelligence Hydra vs. Cyborgs (2005) • Grandmaster + 1 chess program > Hydra (equiv. of Deep Blue) • Amateur + 3 chess programs > Grandmaster + 1 chess program1 1. http://www.collisiondetection.net/mt/archives/2010/02/why_cyborgs_are.php
Visual Analytics = Human + Computer • Visual analytics is "the science of analytical reasoning facilitated by visual interactive interfaces.“ 1 • By definition, it is a collaboration between human and computer to solve problems. 1. Thomas and Cook, “Illuminating the Path”, 2005.
Example: What Does (Wire) Fraud Look Like? • Financial Institutions like Bank of America have legal responsibilities to report all suspicious wire transaction activities (money laundering, supporting terrorist activities, etc) • Data size: approximately 200,000 transactions per day (73 million transactions per year) • Problems: • Automated approach can only detect known patterns • Bad guys are smart: patterns are constantly changing • Data is messy: lack of international standards resulting in ambiguous data • Current methods: • 10 analysts monitoring and analyzing all transactions • Using SQL queries and spreadsheet-like interfaces • Limited time scale (2 weeks)
WireVis: Financial Fraud Analysis • In collaboration with Bank of America • Develop a visual analytical tool (WireVis) • Visualizes 7 million transactions over 1 year • Beta-deployed at WireWatch • A new class of computer science problem: • Little or no data to train on • The data is messy and requires human intelligence • Design philosophy: “combating human intelligence requires better (augmented) human intelligence” R. Chang et al., Scalable and interactive visual analysis of financial wire transactions for fraud detection. Information Visualization,2008. R. Chang et al., Wirevis: Visualization of categorical, time-varying data from financial transactions. IEEE VAST, 2007.
WireVis: A Visual Analytics Approach Search by Example (Find Similar Accounts) Heatmap View (Accounts to Keywords Relationship) Keyword Network (Keyword Relationships) Strings and Beads (Relationships over Time)
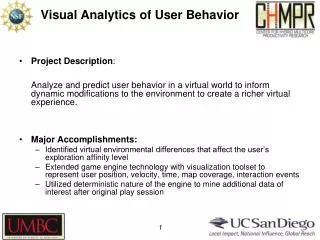
Applications of Visual Analytics • Political Simulation • Agent-based analysis • With DARPA • Global Terrorism Database • With DHS • Bridge Maintenance • With US DOT • Exploring inspection reports • Biomechanical Motion • Interactive motion comparison R. Chang et al., Two Visualization Tools for Analysis of Agent-Based Simulations in Political Science. IEEE CG&A, 2012
Applications of Visual Analytics • Political Simulation • Agent-based analysis • With DARPA • Global Terrorism Database • With DHS • Bridge Maintenance • With US DOT • Exploring inspection reports • Biomechanical Motion • Interactive motion comparison Who Where What Evidence Box Original Data When R. Chang et al., Investigative Visual Analysis of Global Terrorism, Journal of Computer Graphics Forum,2008.
Applications of Visual Analytics • Political Simulation • Agent-based analysis • With DARPA • Global Terrorism Database • With DHS • Bridge Maintenance • With US DOT • Exploring inspection reports • Biomechanical Motion • Interactive motion comparison R. Chang et al., An Interactive Visual Analytics System for Bridge Management, Journal of Computer Graphics Forum,2010. To Appear.
Applications of Visual Analytics • Political Simulation • Agent-based analysis • With DARPA • Global Terrorism Database • With DHS • Bridge Maintenance • With US DOT • Exploring inspection reports • Biomechanical Motion • Interactive motion comparison R. Chang et al., Interactive Coordinated Multiple-View Visualization of Biomechanical Motion Data, IEEE Vis (TVCG) 2009.
VALT Research Projects • Analysis-- Jordan Crouser: • Human + Computer computation • Network (political science) analysis • Visualization Design -- Samuel Li & OrkunOzbek: • Generative visual designs • Phylogenetic analysis of visualizations • Interactive Machine Learning -- Eli Brown & Helen Zhao: • Model learning from user interactions • Analytic provenance • Individual Differences -- AlvittaOttley: • Personality factors and Brain Sensing with fNIRS • Uncertainty visualization (medical) • Big Data -- Leilani Battle (MIT) & Liz Salowitz: • Interactive DB Visualization & Exploration (collaboration with MIT)
Analysis (Jordan Crouser) 1. Human + Computer Computation: Can The Two Complement Each Other?
Understanding Human Complexity • Surveyed 1,200+ papers from CHI, IUI, KDD, Vis, InfoVis, VAST • Found 49 relating to human + computer collaboration • Using a model of human and computer affordances, examined each of the projects to identify what “works” and what could be missing Joint work with Jordan Couser. An affordance-based framework for human computation and human-computer collaboration. IEEE VAST 2012. To Appear
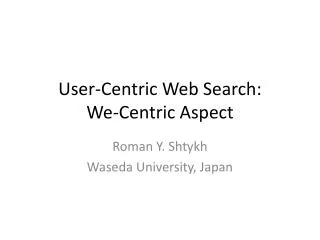
Visualization Design (Samuel Li / OrkunOzbek) 2. Space of Visualization Designs: How Novel Is Your Visualization?
How Similar Are These Visualizations? Jürgensmann and Schulz, “Poster: A Visual Survey of Tree Visualization”. InfoVis, 2010.
Interactive Machine Learning (Eli Brown) 3. Interactive Model Learning: Can Knowledge be Represented Quantitatively?
Direct Manipulation of Visualization Linear distance function: Optimization:
Results Blue: original data dimension Red: randomly added dimensions X-axis: dimension number Y-axis: final weights of the distance function • Tells the users what dimension of data they care about, and what dimensions are not useful! • Usingthe “Wine” dataset (13 dimensions, 3 clusters) • Assume a linear (sum of squares) distance function • Added 10 extra dimensions, and filled them with random values
Individual Differences (AlvittaOttley) 4. A User’s Cognitive Traits & States, Experiences & Biases: How To Identify The End User’s Needs?
Experiment Procedure • 4 visualizations on hierarchical visualization • From list-like view to containment view • 250 participants using Amazon’s Mechanical Turk • Questionnaire on “locus of control” (LOC) • Definition of LOC: the degree to which a person attributes outcomes to themselves (internal LOC) or to outside forces (external LOC) V4 V2 V1 V3 R. Chang et al., How Locus of Control Influences Compatibility with Visualization Style, IEEE VAST 2011.
Results • Personality Factor: Locus of Control • (internal => faster/better with containment) • (external => faster/better with list)
Big Data (Leilani Battle (MIT) & Liz Salowitz) 5. Interactive Exploration of Large Databases: Big Database, Small Laptop, Can a User Interact with Big Data in Real Time?
Analytic Provenance (??) 6. Analyzing User’s Interactions: Do Interaction Logs Contain Knowledge?
What is in a User’s Interactions? • Goal: determine if a user’s reasoning and intent are reflected in a user’s interactions. Grad Students (Coders) Compare! (manually) Analysts Strategies Methods Findings Guesses of Analysts’ thinking Logged (semantic) Interactions WireVis Interaction-Log Vis
What’s in a User’s Interactions • From this experiment, we find that interactions contains at least: • 60% of the (high level) strategies • 60% of the (mid level) methods • 79% of the (low level) findings R. Chang et al., Recovering Reasoning Process From User Interactions. CG&A, 2009. R. Chang et al., Evaluating the Relationship Between User Interaction and Financial Visual Analysis. VAST, 2009.
Summary • While Visual Analytics have grown and is slowly finding its identity, • There is still many open problems that need to be addressed. • I propose that one research area that has largely been unexplored is in the understanding and supporting of the human user.