Water Quality Management Report for Provo River and Deer Creek Reservoirs - 2008
This report examines the water quality management implemented for the Provo River, Jordanelle, and Deer Creek Reservoirs during the 2008 water year. It highlights significant increases in Total Suspended Solids (TSS) load differences between Woodland and Hailstone from 2005 to 2008, potentially linked to construction activities. The analysis reveals high levels of total and dissolved phosphorus from various tributaries, with Spring Creek being a major contributor. Recommendations for monitoring and management strategies are discussed, emphasizing the need for ongoing assessment of water quality parameters.

Water Quality Management Report for Provo River and Deer Creek Reservoirs - 2008
E N D
Presentation Transcript
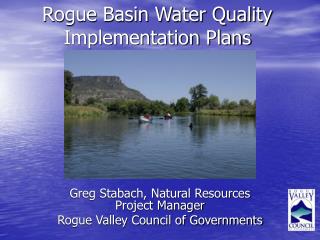
2009 Water Quality Implementation Report Water Quality Management Plan for 2008 Water Year Provo River and Jordanelle & Deer Creek Reservoirs
Upper Provo River • Provo River exhibited greater differences in TSS Load between Woodland and Hailstone in in 2005-2008 as compared to previous years. Construction Activity?
Upper Provo River • Provo River exhibited greater differences in TSS Load between Woodland and Hailstone in in 2005-2008 as compared to previous years. Construction Activity?
Kamas Fish Hatchery • High Total Phosphorus • High Dissolved Phosphorus
Provo River in Heber Valley Spring Creek major contributor of phosphorus & solids to Provo River
Spring Creek Loading to Provo River • 50% - 70% Total Phosphorus Load • 80% - 90% Dissolved Total Phosphorus Load
Flood Control Channel Loading to Provo River • 25% - 30% Total Phosphorus Load • 25% - 30% Dissolved Total Phosphorus Load
Jordanelle Reservoir • TSI has been stable for 5 years Mesotrophic State
Ground Water Monitoring • Higher concentrations typically in southeastern portion of valley. • New monitoring program to examine additional parameters at 4 sites.