Retail Supply Chain Strategy
480 likes | 679 Vues
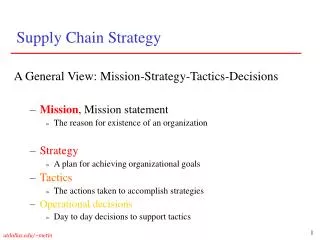
Retail Supply Chain Strategy. Final Presentation 7 May 1998. Agenda.

Retail Supply Chain Strategy
E N D
Presentation Transcript
Retail Supply Chain Strategy Final Presentation 7 May 1998
Agenda 1. Background, Objective and Approach2. Current Environment Assessment3. Target Environment Design & Potential Benefits4. Search for Potential Supply Solutions5. Analysis6. Recommendation & Cost / Benefit Projections
Background and Objective Background • Existing supply chain is complex and inefficient, potentially adding considerable and unnecessary costs. • 70 - 80 deliveries to each site per week • Labour intensive practices to order and receive merchandise and process paperwork • Different stores adopting different approaches to ordering and receiving merchandise Objective • To identify a supply chain solution for the ‘Retail Franchise Channel’ that will: • enable the most effective and overall cost efficient flow of goods to the retail sites • address current business issues • meet the future requirements of the business
Approach and Project Schedule Weeks 1 2 3 4 5 6 7 8 9 10 11 12 Project Tasks w/e 30/1 6/2 13/2 20/2 27/2 6/3 13/3 20/3 27/3 3/4 10/4 17/4 1.1 Assess the current environment 1.2 Design target environment 1.3 Identify and assess alternative service providers 1.4 Evaluation of options and identification of best solution(s) 1.5 Finalise supply chain strategy and recommendations Review meeting
Structure BP’s Retail Fees and Charges. Stores Number of Sites by State Dollar Volumes by State Units Volume by State Inventory Management Store Stockouts Products Sales Volume by Key Categories Units Volume by Key Categories Sales Trends for Top 6 Categories Stock Levels by Key Categories Shrinkage and Obsolescence Rate of Sale and Pack Size Analysis Suppliers Numbers Volumes Key Suppliers by Product Category Supplier Service Levels Processes Item Registration and Price Book Maintenance Order Generation via Hand Held Terminal Order Generation via Stocksheets Order Generation via Rep and Van Sales Stock Receiving and Processing Invoice Reconciliation and Processing Technology Current capabilities Current Environment Assessment
Store Numbers Total 380 Total 350 Total 172
Store Sales Volumes Sales Volume - 1997 Sales Volume - 2002 • Average Express weekly turnover $25,000, growing to $40,000 in 2002 • Average Shop weekly turnover projected to remain around $16,000 • Total sales $200m in 1997, projected to grow to $580m in 2002.
Store Inventory Management Average 27 days No. of stores Average Days Stock Holding for fiscal 1997
Store Stockouts Average Stockouts 10.5%
Takeaway 2.7% Chips 4.3% Bread 4.8% Grocery 5.1% Ice Cream 6.3% Milk 11.2% Bakery 11.4% Product Volumes - Sales $ and Units Takeaway 2.1% Confect. 17.4% Cigarettes 32.5% Chips 2.7% Bread 3.1% Ice Cream 3.3% Variety 3.4% Grocery 5.6% Bakery 5.7% Drinks 14.8% News 5.7% Cigarettes 13.4% Drinks 11.5% Confect. 8.5% Milk 8.9% Sales Dollars by Department Unit Volume by Department
Key Issues • Sales are being lost through store stockouts • Store stockouts not measured and not previously considered a problem • No measure on how well suppliers are fulfilling orders. Supplier service levels not measured • Shrinkage levels are high by retail standards • Poor or no controls on the flow of merchandise through the organisation • No record of orders placed • Limited invoice cost price checking • Receipts posted to wrong departments (not accurately capturing goods inwards) • No perpetual inventory • Not 100% Scanning or item specific PLU (not accurately capturing goods outwards) • Inefficient inventory management • Level of store stockouts • Wide range of stock levels across stores • Wide range of inventory levels across departments • Low understanding and priority on Inventory Management, both in stores & head office.
Key Issues • Inefficient processes within the current chain. • Item Registration and Maintenance • Manually done apart from range purchased from Davids and FAL • Stock Ordering • Order quantification manually calculated (and therefore subjective) • Orders created by many different means (HHT, Phone, Stocksheet) and by different people (store, supplier representative) • Receiving • Many suppliers, all delivering direct to store - 70 plus deliveries per week • Physical checking being done on all orders received • Invoice Processing • Many invoices received in mail, manually matched to delivery dockets and details keyed into system • Unable to comprehensively cost price check because of laborious process • Time spent chasing up problems • No urgency to improve supply chain performance. • At store level feeling is things are OK, no major problems • In HO stock ordering , receiving and management in general seen as part of the stores domain • There is no end to end view or ownership of the supply chain - structurally and functionally divided. • Whatever is determined must be proven of value to the store, to achieve buy in, acceptance and execution.
Supply Chain Objective “To develop a supply chain that is Customer focused and Demand driven, that will ensure all stores are kept in stock of all items, at all times, with the least amount of inventory required and at the lowest overall cost.” The outcome should be: • increased sales, through an improved in stock situation in stores • improved margins, through • shrinkage reduction, and • getting product cheaper to shelf (lower purchase and distribution costs) • lower inventory levels, from better inventory management, • lower operating costs, through more efficient ordering, receiving and associated administrative processes Achievement of this objective and the stated outcomes are dependent on: • Processes. New processes and changes to existing processes will be required • Structure. The most overall cost efficient supply structure needs to identified and selected.
Processes Recommended Changes: Tech. Req. Proc. Change Training Req. Product Selection • Based on total cost to shelf Medium Cat. Mgr. Item Registration & Maintenance • Electronic download from suppliers Minor Minor Cat. Co-Ord. Forecasting • First preference: Send sales data Minor Minor Cat. Co-Ord. • Provision of Forecast Data Major Major Cat. Co-Ord. Purchase Order Generation - Normal • Automated sales driven replenishment Minor Stores • Model stock maintenance Medium Medium Stores / Cat. Mgr. • Centralised Processing • Electronic transmission Minor Minor Cat. Mgr. • Daily Ordering, ability to set schedules • Order multiple of one, no minimum order stipulations • Perpetual inventory Minor Minor Stores • Purchase order file Medium Purchase Order Generation - Promotional • Separate promotional orders Minor Minor Stores
Processes Recommended Changes: Tech. Req. Proc. Change Training Req. Supplier Delivery • Single unit picking • Short lead times • Daily frequency • Advance Ship Notice & Shipper Container Marking Store Receipt and Goods Processing • Scan receipt Medium Minor Stores • Random sample checking Minor Stores • Automatic reconciliation to purchase order Minor Stores • Claim for credit Minor Stores • Inter site transfers Minor Minor Stores • Supplier service level reporting Minor Minor Cat. Mgr. / Co-Ord. Invoice Processing • Evaluated receipt - abolition of invoice Minor Minor Cat. Mgr. Customer Service • Store stockout reporting Minor Minor Cat. Mgr / Co-Ord & Stores • Point of Sale scanning Minor Cat. Mgr. & Stores Signed off with: Andrew Baird - representing the Franchise Channel and the Merchandise Office Celine Amoyal, Dean Salter, Robert Wilson, - Franchise Development Unit Max Wieselmann, - Retail Systems.
Structure Options 1. One Supplier, One Delivery 2. Multiple Suppliers, One Delivery
Structure Options 3. Multiple Suppliers, Multiple Deliveries • Each product category and region to be assessed against each model to determine • the most appropriate solution. • The best solution will be determined by: best buying price • lowest handling cost • lowest delivery cost • without sacrificing quality
Potential Benefits Potential profit increase Today 2002 Sales increase 3% ($6.19m) $1.9m $5.1m 39% Shrinkage decrease 20% $1.0m $2.9m 22% Inventory decrease 25% ($2.80m) $0.6m $1.2m 9% 70% Operating cost savings: Order Generation $0.5m $1.1m 8% Goods Receipting $0.6m $1.4m 12% Invoicing Processing $0.7m $1.5m 10% 30% Total Store Savings $5.3m $13.1m * Only a % of the Sales benefit, the shrinkage reduction and increased GP $ flows directly through to BP.
Potential Solution / Service Providers In searching for potential solutions with regard to Supply Chain Structure, four areas were assessed: 1.C - Store Competitors: • 7 - Eleven: • Shell: • Mobil Quix: • Ampol - Caltex: • Burmah: 2. Supermarket Chains • Woolworths • Coles • Franklins • Davids Conclusion: All C-Store operators are currently being predominantly supplied by route and existing wholesalers. All are seeking a better solution. None have yet found one. Conclusion: Confirmed AIW (Woolworths) and M-C Australia (Davids) as potential wholesale providers. Ruled out Coles and Franklins as potential providers.
Potential Solution / Service Providers 3. Wholesalers • AIW • M-C Australia • FAL 4. Logistics and Food Service Providers • Toll (TNT) • Mayne Logistics • Linfox • TDG • Brambles • Clelands • PFD Food Services Conclusion: On the surface should be the ideal solution - one stop shop for all purchases, better buying prices from their bulk purchasing power, specialists in distribution and one only delivery. Conclusion: Each had demonstrated strengths and experience in providing logistics solutions for food and beverage products and retail customers.
Approach Wholesalers • Existing negotiations by BP continued Logistics / Food Service Providers: • Initial contact made and exploratory meeting held • Interest confirmed - all were most interested • Confidentiality Deed signed • ‘Expression of Interest’ Document sent • Responses due 20/3/98 Submissions were to be assessed on: • Product Cost • Rebate allowance • Service Fee • Distribution Fee • No. of deliveries removed • No. of suppliers covered • Geographic coverage • Delivery frequency • Extent of services offered • Technical capabilities
Outcome Major wholesalers. • M-C Australia • FAL • AIW Logistics and Food Service Providers • Linfox. • Clelands. • TDG. Declined. • Brambles. Declined. • Mayne Logistics. Unsatisfactory response. • Toll. Unsatisfactory response. • PFD. Unsatisfactory response.
5. Analysis 5.1 Service Providers. 5.2 Product Channels. 5.3 Key Requirements.
5.1 Service Providers Purchase price variations for each structure were not taken into account.
5.1 Service Providers 1. Bread, Milk and News excluded. 2. Single Units for Auto, Grocery (including Frozen), Variety and Takeaway in all cases. 3. Potential to leverage a better product cost off the Wholesaler not taken into account.
5.1 Service Providers Extremely difficult to compare because: • M-C and AIW quoting as % of purchase price • Linfox and Clelands quoting as cost per unit. • M-C charge 3-4.5% for cartons, extra 7% for single units, nothing in between • AIW charge 4.5% - 6.5% for cartons, extra 4% for half case, will not do single units • M-C and AIW have different purchasing prices and structures • Linfox and Cleland prices are indicative only. However: • Sufficient evidence to suggest that the third party option may be a viable solution. • Linfox and Clelands have difficulty in understanding the need for a viable solution for single unit distribution. • A cost effective solution does not currently exist in this country, in this industry. It will take some time to eventuate. • In the short term, focus on single units for Auto, Grocery (including Frozen) and Variety only.
5.2 Product Channels Each department was analysed for its product attributes and requirements, and the particulars of its supplier base. From this analysis four specific distribution channels were identified.
5.2 Product Channels Purchases (1997) by Product Channel
5.3 Key Requirements Potential profit increase Today 2002 Sales increase 3% 85% $1.86m $1.58m $5.14m $4.37m Shrinkage decrease 20% 85% $1.03m $0.88m $2.85m $2.42m Inventory decrease 25% 25% $0.56m $0.14m $1.19m $0.30m Operating cost savings: Order Generation 85% $0.49m $0.42m$1.06m $0.90m Goods Receipting 50% $0.63m $0.32m$1.35m $0.68m Invoicing Processing 50% $0.72m $0.36m$1.54m $0.77m Total Savings $5.29m $3.70m $13.14m $9.44m 70% 72%
Commence immediately to develop the following process capabilities. Recommendation 1: 1. Perpetual Inventory • Purchase Order File. • Automatic reconciliation to purchase order. • Adjustment receipting - claims, bonus offers, transfers and physical counts. • Stock out reporting. 2. Automated Ordering • Electronic Transmission of Purchase Orders. • Model Stock smarts. 3. Receiving • Electronic Receipt. 4. Other • Electronic item registration and maintenance. • Evaluated Receipt. • Supplier Service Level reporting.
Recommendation 2. Confirm providers for each channel • Evaluate / confirm the correct provider for each supply channel. Continue discussions with M-C and AIW and move to the next phase with Clelands and Linfox. • Identify those product / suppliers who are in the correct channel, and with whom the processes can be introduced immediately. ie. Can start immediately with suppliers in Channels 3 & 4. • Identify those product / suppliers who must be moved to the correct channel before implementing processes. • Implement processes with selected channel providers. Preparation of processes and confirmation of channel providers can continue immediately and simultaneously. Implementation of these processes is contingent on the selection of channel providers being confirmed.
Dec June Dec June Dec June Dec June Total 98 99 99 00 00 01 01 02 Project Management ? ? ? ? ? ? ? ? ? Document req’s -45 -45 Technical spec’s -79 -79 Technical d/ ment -191 -56 -247 Training d/ ment -23 -20 -43 Site Training -136 -128 -264 Facilities -33 -30 -63 Travel and Accom. -30 -23 -53 Total Costs -275 -181 -338 -794 Sales Increment Fee 311 523 587 656 693 722 Additional GP$ 226 379 433 490 Shrink $ 187 312 358 403 Total Benefits 311 523 1000 1347 1484 1616 Net Return -275 130 523 1000 1347 1484 1616 -338 Costs and Benefits to BP
Costs and Benefits to BP $1,800,000 $1,600,000 Total Costs Shrink Savings $'s $1,400,000 Additional GP$'s $1,200,000 Fees on Sales Increment $1,000,000 $800,000 $600,000 $400,000 $200,000 $0 Dec-98 Jun-99 Dec-99 Jun-00 Dec-00 Jun-01 Dec-01 Jun-02 -$200,000 -$400,000
Incremental Income Share $3,500,000 Stores $3,000,000 Income BP $2,500,000 Income $2,000,000 $1,500,000 $1,000,000 $500,000 0 Jun-99 Dec-99 Jun-00 Dec-00 Jun-01 Dec-01 Jun-02