Enhancing V&V Focus: Analyzing SDL Module Complexity and Error Correlation
This case study explores how a company developing hardware and software utilized a Goal-Question-Metric (GQM) approach to identify factors contributing to software complexity and errors in their SDL modules. Conducted workshops led to metrics collection on module characteristics such as the number of states, input signals, and documentation length. ANOVA analyses revealed significant correlations between perceived complexity and the number of output signals and documentation length. Findings suggest targeting SDL modules with extensive descriptions and numerous output signals to reduce error rates effectively.

Enhancing V&V Focus: Analyzing SDL Module Complexity and Error Correlation
E N D
Presentation Transcript
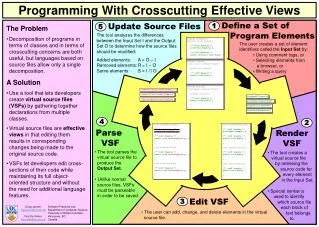
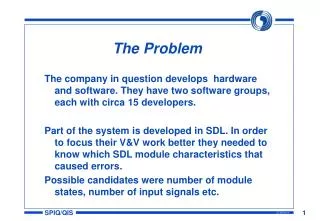
The Problem The company in question develops hardware and software. They have two software groups, each with circa 15 developers. Part of the system is developed in SDL. In order to focus their V&V work better they needed to know which SDL module characteristics that caused errors. Possible candidates were number of module states, number of input signals etc.
What to measure? In order to get a consistent and efficient data collection and analysis, we started with a GQM process. This consisted of • A half-day basic course in GQM. • A half-day workshop where they identified • the questions that needed answers. • which metrics they needed in order to answer these questions.
The Metrics Some of the metrics that were collected for each SDL module: • Number of errors found. • Subjective - perceived - complexity. • Number of pages of SDL description. • Number of SDL states • Number of signals in • Number of signals out
What makes it complex - 1 In order to answer this question we went through all the hypothesis put forward by the developers during the GQM session. We will look at three of them: • Number of states - M5 • Number of signals out - M9 • Number of pages in the SDL description - M10
What makes it complex - 2 The identified problems were well suited for ANOVA analysis. The data for the three metrics M5, M9 and M10 were sorted according to the complexity scores (High, Medium and Low). An ANOVA analyses was then performed for each data set. We decided to require p-value better than 10%
ANOVA results - 1 Number of states: Source of Variation SS df MS P-value Between Groups 1190,042 2 595,0208 0,254299 Within Groups 1631,833 5 326,3667 Number of states does not contribute significantly to the complexity as perceived by the developers.
ANOVA results - 2 Number of signals out: Source of Variation SS df MS P-value Between Groups 2779,042 2 1389,521 0,098013 Within Groups 1813,833 5 362,7667 Number of signals outcontribute significantly to the complexity as perceived by the developers
ANOVA results - 3 Number of pages in the SDL description: Source of Variation SS df MS P-value Between Groups 5586,042 2 2793,021 0,040168 Within Groups 2133,833 5 426,7667 Number of pages in the SDL description contribute significantly to the complexity as perceived by the developers
Summary - 1 SDL module complexity as perceived by the developers depends on two factors: • Number of signals out • Number of pages in the SDL description The other suspected factors identified during the GQM process did not give a significant contribution.
What about Errors Now that we have some ideas on what makes a module look complex to the developers, the next step was to see if there is any connection between module complexity and the number of errors in the modules. As before, the ANOVA can give us an answer.
Complexity and Errors - 1 Errors and complexity Source of Variation SS df MS F P-value Between Groups 1646,833 2 823,4167 0,057379 Within Groups 770,6667 5 154,1333 It is reasonable to assume that complex modules have more errors.
Complexity and Errors - 2 If we look at the summary table form ANOVA, we see that the differences are quite large: Groups Count Sum Average Variance Column 1 3 102 34 343 Column 2 3 22 7,333333 41,33333 Column 3 2 2 1 2 However, due to few observations for each complexity level, the variances are large also. Thus, we should not be too categorical.
Conclusions With all the necessary caveats in mind the company decided as follows: In order to reduce the number of errors we need to single out modules with : • Large descriptions - more than 35 pages of SDL description. • Many signals out - more than 30. The limiting values are the average values from the ANOVA summary tables.