Download
1 / 28
290 likes | 350 Vues
Learn how to represent motion through position, direction, and speed using measurement and time-distance graphs. Understand concepts like reference points, velocity, and average speed. Practice solving equations and graphing speed for better comprehension.

E N D
Forces and Motion 5.1 – Use measurement & time-distance graphs to represent the motion of an object in terms of its position, direction or speed.
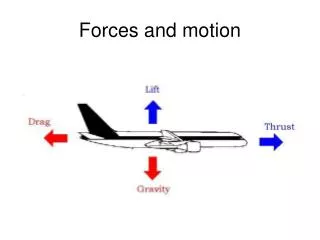
Motion • Motion is a change in position of an object with respect to time. • The following terms are used to describe and measure motion. • Position • Direction • Speed
Position • Position – the location of an object. Change in position is measured by distance (length of the path) moved from one position (reference point) to another. • What is a reference point? Class demonstration: One volunteer and the rest of the class is split into two groups. This activity will illustrate the idea of a reference point.
Reference Point – is a place or object used for comparison to determine if something is in motion. An object is in motion if it changes position relative to a reference point.
Direction • Direction – is the relationship of the position of a moving object to another position.
Speed • Speed – is the rate of change in position or “rate of motion”. How long it takes to move from point A to B. • Speed does not necessarily mean that something is moving fast.
Average Speed • The average speed of an object tells you the (average) time at which it covers a given distance. • Average speed is the result of the total distance divided by the total time taken.
Calculating Average Speed(v = d/t) • v = d/t where: • v is the average speed of an object • d is the distance or length of the path of the object • t is the time taken to cover the path • Speed is measured using the following types of units: • meters per second (m/s) • kilometers per hour (km/h) • miles per hour (mph)
What is the difference between speed and velocity? Velocity is speed with direction
V=d/t t=d/v d=vt d v t
TO HELP SOLVE EQUATIONS, HERE IS A STEP BY STEP GUIDE TO FOLLOW. G U E S S G – find your Givens U – what is your Unknown (trying to find) E – what is the Equation you need? S – Substitute your givens S - Solve
Examples: • Calculate the speed of an object using the following information: t = 35 s and d = 50m Step 1 – GUESS Givens are t = 35 s and d = 50 m Unknown: v Equation: v = d / t Substitute: v = 50 / 35 Solve: v = 50 divided by 35
Examples • Suppose a cyclist travels 32 kilometers during the first two hours of riding, and 13 kilometers during the next hour. Calculate the average speed: -total distance = 32km + 13km -total time = 2h + 1h Average speed: 45km/3h = 15km/h or 15 kilometers per hour
Examples • Use the speed equation to determine how far an object traveled. v=7m/s t=3s How far did the object travel? Rearrange v=d/t d=vt d=7m/s(3s) d=21m
How long will it take to get to Atlanta, GA for a Falcons game from Greenville, SC (145 miles or 233 km). You know you can travel about 70 mph? • 2. If a bamboo plant grows 28 centimeters in 11 days, what was the average speed the plant grew per day? • 3. A soccer player was practicing on the soccer field last week. He ran back and forth on the field for a total of 750 yards. His average speed was 12 yards per second. How long did it take him to finish?
Graphing Speed • Do you think it is possible to represent speed using a graph? • If so, what type of graph would you use? • Line graph, bar graph, circle graph????
When graphing speed you would use a line graph. • A line graph shows the relationship between distance and time and how it relates to speed. • The slope of the line gives us information about the speed and direction of an object.
You graph speed by taking measurements of time and distance. • For instance: The following measurements were taken on how fast a turtle walks along a path.
B C A At position A, is the object moving away from or towards the reference point? At position C, is the object moving away from or towards the reference point?
The flatter the slope, the slower the speed. The steeper the slope, the faster the speed.
When the slope of the line is horizontal to the x-axis, the speed is zero (the object is not moving)
Examples: • Lets graph the motion of a drag racer. Have to allow for a #25 and #35 on your X axis!
First, we need to label the data x and y. X axis Y axis
Practice Problem: • Graph the speed of an object as it travels down hill. Graph the speed of an object as it travels up hill.