Download
1 / 17
170 likes | 282 Vues
This report analyzes the Facility Condition Index (FCI) and Deferred Maintenance (DM) values for NNSA assets, assessing their overall condition and future needs. It presents data on Replacement Plant Value (RPV) in billions, DM backlog in millions, and facility assessments based on gross square footage. Key insights include the impact of Facility Condition Index on mission-critical functions, the classification of facilities into good, fair, and poor condition, and an overview of historical trends in maintenance and facility disposition from FY 2002-2010.

E N D
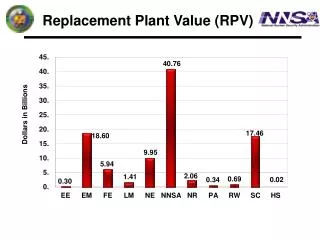
Replacement Plant Value (RPV) Dollars in Billions
Deferred Maintenance (DM) Dollars in Millions
Facility Condition Index (FCI) FCI (%)
DOE Gross Square Feet (GSF) Number in Millions
NNSA Condition of Enterprise % of Total Enterprise by Number of Facilities
NNSA Condition of Enterprise % of Total Enterprise by GSF
NNSA Deferred Maintenance Backlog and Facility Condition Index (FCI)
Deferred Maintenance Condition Index (ACI) Good: ACI > .95 Fair: ACI between .9 and .95 Poor: ACI < .9 NNSA: CI and Backlog prediction Model (Includes Inflation) ($000) FIRP Completes its Mission
Facility Condition Index by Mission Dependency
Facility Condition Index for MC & MDNC
Impact of FIRP on Legacy Deferred Maintenance (DM) Buy down ($M) 900 M
NSE Transformation – Excess Disposition FY 2002 – FY 2009
NNSA IFI Elimination of Excess FY 1990 – FY 2010 Data source: FY90 – FY01: “SPEIS” chart FY02 – FY04: TYSP & FIMS adjustment for OST, SC & OR FY05 – FY10: FIMS snapshot
NNSA Owned, Permitted and • Leased Facilities • NNSA owns the vast majority of its assets: 7,656 of 7,932. The remainder are permitted or leased directly by DOE, contractor, or GSA.
Number of Facilities Mission Critical (MC) and Mission Dependency Not Critical (MDNC)