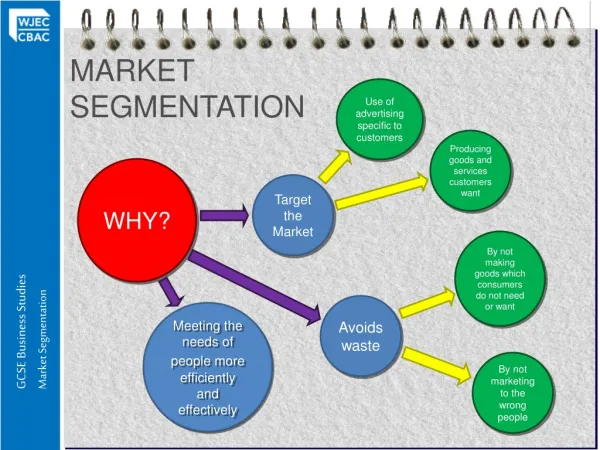
Market Segmentation
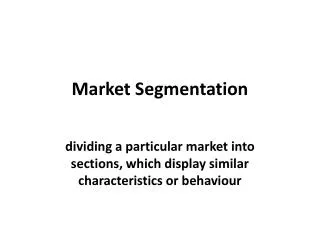
Market Segmentation. Market segmentation is the subdividing of a market into distinct subsets of customers. Segments Members are different between segments but similar within. Segmentation Marketing. Definition

Market Segmentation
E N D
Presentation Transcript
Market Segmentation • Market segmentation is the subdividing of a market into distinct subsets of customers. Segments • Members are different between segments but similar within.
Segmentation Marketing Definition Differentiating your product and marketing efforts to meet the needs of different segments, that is, applying the marketing concept to market segmentation.
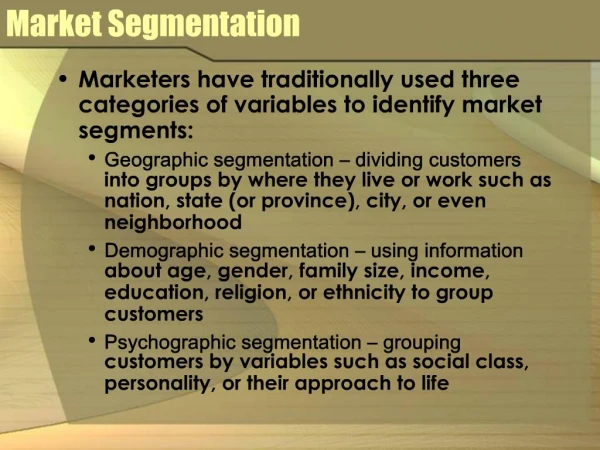
Primary Characteristicsof Segments • Bases—characteristics that tell us why segments differ (eg, needs, preferences, decision processes). • Descriptors—characteristics that help us find and reach segments. (Business markets) (Consumer markets) Industry Age/Income Size Education Location Profession Organizational Life styles structure Media habits
A Two-Stage Approachin Business Markets Macro-Segments: • First stage/rough cut • Industry/application • Firm size Micro-Segments: • Second-stage/fine cut • Different customer needs, wants, values within macro-segment
Relevant Segmentation Descriptor Variable A: Climatic Region 1. Snow Belt 2. Moderate Belt 3. Sun Belt Fraction of Customers Segment 1 Segment 2 Segment 3 0 100% Likelihood of Purchasing Solar Water Heater (a)
Irrelevant Segmentation Descriptor Variable B: Education 1. Low Education 2. Moderate Education 3. High Education Fraction of Customers Segment 1 Segment 2 Segment 3 0 100% Likelihood of Purchasing Solar Water Heater (b)
Consumer Industrial Segmentation Needs, wants benefits, Needs, wants benefits, solutions to Bases solutions to problems, problems, usage situation, usage rate, usage situation, usage rate. size*, industrial*. Descriptors Age, income, marital status, Industry, size, location, current Demographics family type & size, supplier(s), technology utilization, gender, social class, etc. etc. Psychographics Lifestyle, values, & Personality characteristics of personality characteristics. decision makers. Behavior Use occasions, usage level, Use occasions, usage level, complementary & complementary & substitute substitute products used, products used, brand loyalty, order brand loyalty, etc. size, applications, etc. Decision Making Individual or group Formalization of purchasing (family) choice, low or high procedures, size & characteristics involvement purchase, of decision making group, use of attitudes and knowledge outside consultants, purchasing about product class, price criteria, (de)centralizing buying, sensitivity, etc. price sensitivity, switching costs, etc. Media Patterns Level of use, types of Level of use, types of media used, media used, times of use, time of use, patronage at trade shows, etc. receptivity of sales people, etc. Variables to Segmentand Describe Markets
Segmentation in Action A Marriott Hotel used to be a Marriott Hotel: An upscale hotel catering to business people, pleasure seekers and international and group travelers. Today, besides the Marriott Hotels (the company’s major business), there are Marriott Suites, Residence Inns, Courtyards by Marriott and Fairfield Inns—each serving a smaller, targeted segment of the market. —Lenneman and Stanton, “Mining forNiches,” Business Horizons.
Segmentation in Action We segment our customers by letter volume, by postage volume, by the type of equipment they use. Then we segment on whether they buy or lease equipment. Based on this knowledge, we target our marketing messages, fine tune our sales tactics, learn which benefits appeal to which customers and zero in on key decision makers at a company. —Kathleen Synnot, VP, Worldwide Marketing Mailing Systems Division, Pitney Bowes, Inc. [quoted in Marketing Masters (Walden and Lawler)]
Customers’ Diverse Needs Require Diverse Channels Kodak increases customer contact and support with a three tiered distribution system. . . . Business Imaging Division created three avenues for marketing microfilm, supplies and imaging systems and software: • direct sales reps (for more complex systems); • brokers and distributors (for film sales and delivery); • Components Marketing Division (to sell to system integrators and VARs). —Business Marketing
Ad in London Newspapers, 1900 Men wanted for hazardous journey. Small wages, bitter cold, long months of complete darkness, constant danger, safe return doubtful. Honor and recognition in case of success. —Ernest Shackleton, Arctic Explorer Did it work?
Segmentation If you’re not thinking segments, you’re not thinking. To think segments means you have to think about what drives customers, customer groups, and the choices that are or might be available to them. —Levitt, Marketing Imagination
Segmentation Marketing Implies a “Market” A market consists of all the potential customers sharing a particular need or want who might be willing and able to engage in exchange to satisfy that need or want. —Kotler, Marketing Management
Market Definition Customer-Need Set 1 (Market 1) ð Common customer needs define a market not a product. Product 1 Technology A Customer-Need Set 2 (Market 2) Technology B
Implications 1. Segmentation defines common customer needs. 2. Those common needs may be satisfied by similar or dissimilar technologies or have different solutions. Ex: Customer dissatisfaction at long delays at supermarket checkout. Solution 1: Faster UPC scanner systems. Solution 2: Entertainment/Sales systems on checkout lines. Note: Total solution defines (competitive) market, not product or technology.
Market Definition Approaches Customer-Behavior: • Demand cross elasticity • Brand/product switching Perception/Judgment: • Engineering/technological substitution • Customer judgments/perceptual mapping
Why is Market Definition Important? • Strategy(What to focus on). • Resource allocation(How much/where/when?). • Feedback/performance measurement(How well are we doing? How can we learn from our actions?).
Electric Typewriter Market 1980 1981 1982 1983 1984 1985 Shipments A (Us) 403,027 495,192 548,905 550,351 541,388 515,000B 369,916 388,520 349,396 323,005 342,197 297,000Other 367,057 324,010 343,885 370,374 202,495 129,070Total 1,140,000 1,207,722 1,242,186 1,243,730 1,086,080 941,070 Market Shares (%) A (Us) 35.4 41.0 44.2 44.2 49.8 54.7B 32.4 32.2 28.1 26.0 31.5 31.6Other 32.2 26.8 27.7 29.8 18.6 13.7
Word Processor Market 1980 1981 1982 1983 1984 1985 Shipments A (Us) 403,027 495,192 548,905 550,351 541,388 515,000B 369,916 388,520 349,396 323,005 342,197 297,000Other Electric 367,057 324,010 343,885 370,374 202,495 129,070 Electronic WordProcessors 60,040 112,220 209,800 392,352 733,699 1,372,016 Total 1,200,040 1,319,942 1,451,986 1,636,082 1,819,778 2,313,086 Market Shares (%) A (Us) 33.6 37.5 37.8 33.6 29.8 22.3B 30.8 29.4 24.1 19.7 18.8 12.8Other Electric 30.6 24.5 23.7 22.6 11.1 5.6 Electronic WordProcessors 5.0 8.5 14.4 24.0 40.3 59.3
Market Definitionby Switching Behavior Current Purchase Occasion Diet Diet Diet Coke Coke Pepsi Pepsi Sprite Sprite Total Coke 53% 9% 27% 4% 5% 2% 100%Last Diet Coke 12% 61% 4% 15% 2% 5% 100%Purchase Pepsi 24% 3% 58% 9% 5% 1% 100%Occasion Diet Pepsi 4% 14% 11% 63% 2% 6% 100% Sprite 21% 2% 17% 3% 52% 6% 100% Diet Sprite 2% 15% 2% 12% 7% 61% 100%
STP as Business Strategy Segmentation • Identify segmentation bases and segment the market. • Develop profiles of resulting segments. Targeting • Evaluate attractiveness of each segment. • Select target segments. Positioning • Identify possible positioning concepts for each target segment. • Select, develop, and communicate the chosen concept. … to create and claim value
How STP Adds Value to a Firm Segmentation Identify segments Targeting Select segments Positioning Create competitive advantage Marketing resources are focused to better meet customers needs and deliver more value to them Customers develop preference for brands that better meet their needs and deliver more value Customers become brand/supplier loyal, repeat purchase, communicate favorable experiences Brand/supplier loyalty leads to increased market share and creates a barrier to competition Fewer marketing resources needed over time to maintain share due to brand or supplier loyalty Profitability (value to the firm) increases
STPing the Market for Eggs Segments:Disinterested consumers Casual Egg UsersHealth conscious consumers Enthusiastic users Profiles:BeliefsAttitudesLifestylesHealth/Nutrition consciousnessMedia habitsConsumption habitsDemographics —Frank and Phillips,Agribusiness, July 1990
Health Conscious Strategy Casual Users Consumers Enthusiastic Users Positioning Convenient and Ideal and natural Traditional food with useful in many food, good for the many applications. situations. family. Very convenient, good for the family. Copy Informal Health-oriented Larger family setting.Visuals settings. personality or Major meal, possibly situation. with guests. Copy Easy pace, Fresh, clean Reinforcing, emphasisTonality relaxed setting, very on benefits and wide atmospher. natural. use. Promotions Reminders at Matter-of-fact Simple reminders to checkout, egg information on the buy eggs. display, or nutritional value dairy. and health attributes of eggs in recipes and leaflets. Targeting and Positioning
Overview of Marketing Engineering Methods for STP • Clustering and discriminantanalysis (PDA2001 exercise) • Choice-based segmentation(ABB Electric) • Perceptual mapping(G20 exercise)
Segmentation (for Carpet Fibers) Perceptions/Ratings for one respondent: Customer Values .. .. . . . . . . . . . . . . . D . . . . A . . . . . . Strength (Importance) .. .. Distance between segments C and D . . . . . . . . B . . . C . . . . . . . . . A,B,C,D: Location of segment centers. Typical members: A: schools B: light commercial C: indoor/outdoorcarpeting D: health clubs . . . . Water Resistance (Importance)
. . . . . . . . . . . . Targeting Segment(s) to serve . . . . . . . . . . . . . . . . . . . . . . Strength(Importance) . . . . . . . . . . . . Water Resistance (Importance)
. . . . . . . . . . . . . . . . . . . . . . . . . . . . . . . . . . . . Positioning Product Positioning . . Us . Comp 1 Comp 2 Strength(Importance) Water Resistance (Importance)
A Note on Positioning Positioning involves designing an offering so that the target segment members perceive it in a distinct and valued way relative to competitors. Three ways to position an offering: 1. Unique (“Only product/service with XXX”) 2. Difference (“More than twice the [feature] vs. [competitor]”) 3. Similarities (“Same functionality as [competitor]; lower price”) What are you telling your targeted segments?
Steps in a Segmentation Study • Articulate a strategic rationale for segmentation (ie, why are we segmenting this market?). • Select a set of needs-based segmentation variables most useful for achieving the strategic goals. • Select a cluster analysis procedure for aggregating (or disaggregating customers) into segments. • Group customers into a defined number of different segments. • Choose the segments that will best serve the firm’s strategy, given its capabilities and the likely reactions of competitors.
Total Customer Value = Price/Performance Functional Value (What does this product do for me?) + Supplier/Service Value What does the product mean to me? (What is the insurance? service? psychological? value of the product or supplier?) Advertising Selling Service Efforts
Customer Needs and Buying Process Behaviors Ignore Present State Postpone Perceived and Psychological Needs Functional and Economic Needs Engage in Purchase Process • Search for options • Evaluate options • Choose option • Purchase Option • Use Option Desired State · Motivation Customer Value Measurement Approaches Perceptual Measures of Value Objective Measures of Value Behavioral Measures of Value Customer Needs and Customer Value Measurement
CustomerValue Customer Value Assessment Procedures Attitude-Based Behavior-Based Inferential/Value Based • Choice models • Internal engineering assessment • Neural networks • Indirect survey questions • Discriminant analysis • Field value-in-use assessment Indirect/(Decompositional Methods)Direct Questions • Conjoint analysis • Preference Regression UnconstraintedConstrained/Compositional Methods • Focus groups • Multiattribute value analysis • Direct survey questions • Benchmarking • Importance and attitude ratings • Rule-based system/AI/expert systems
Segmentation: Methods Overview • Factor analysis (to reduce data before cluster analysis). • Cluster analysis to form segments. • Discriminant analysis to describe segments.
Cluster Analysis forSegmenting Markets • Define a measure to assess the similarity of customers on the basis of their needs. • Group customers with similar needs. The software uses the “Ward’s minimum variance criterion” and, as an option, the K-Means algorithm for doing this. • Select the number of segments using numeric and strategic criteria, and your judgment. • Profile the needs of the selected segments (e.g., using cluster means).
Cluster Analysis Issues • Defining a measure of similarity (or distance) between segments. • Identifying “outliers.” • Selecting a clustering procedure • Hierarchical clustering (e.g., Single linkage, average linkage, and minimum variance methods) • Partitioning methods (e.g., K-Means) • Cluster profiling • Univariate analysis • Multiple discriminant analysis
• • • • • Perceptions or ratings datafrom one respondent III Dimension 2 b • • • • • • • a II I Dimension 1 Doing Cluster Analysis a = distance from member to cluster center b = distance from I to III
Single Linkage Cluster Example Distance Matrix Co#1 Co#2 Co#3 Co#4 Co#5 Company #1 0.00Company #2 1.49 0.00Company #3 3.42 2.29 0.00Company #4 1.81 1.99 1.48 0.00Company #5 5.05 4.82 4.94 4.83 0.00 ResultingDendogram 1 2 3 Company 4 5 1 2 3 4 5 Distance
Ward’s Minimum Variance Agglomerative Clustering Procedure First Stage: A = 2 B = 5 C = 9 D = 10 E = 15 Second Stage: AB = 4.5 BD = 12.5 AC = 24.5 BE = 50.0 AD = 32.0 CD = 0.5 AE = 84.5 CE = 18.0 BC = 8.0 DE = 12.5 Third Stage: CDA = 38.0 CDB = 14.0 CDE = 20.66 AB = 5.0 AE = 85.0 BE = 50.5 Fourth Stage: ABCD = 41.0 ABE= 93.17 CDE = 25.18 Fifth Stage: ABCDE = 98.8
Ward’s Minimum Variance Agglomerative Clustering Procedure 98.80 25.18 5.00 0.50 A B C D E
Interpreting Cluster Analysis Results • Select the appropriate number of clusters: • Are the bases variables highly correlated? (Should we reduce the data through factor analysis before clustering?) • Are the clusters separated well from each other? • Should we combine or separate the clusters? • Can you come up with descriptive names for each cluster (eg, professionals, techno-savvy, etc.)? • Segment the market independently of your ability to reach the segments (ie, separately evaluate segmentation and discriminant analysis results).
Profiling Clusters Two Cluster Solution for PC Data: Need-Based Variables 1 Design Means of Variables 0 Business –1 size power office use LAN color storage needs wide connect. periph. budget
Criterion Examples of Considerations I. Size and Growth 1. Size • Market potential, current market penetration 2. Growth • Past growth forecasts of technology change II. Structural Characteristics 3. Competition • Barriers to entry, barriers to exit, position of competitors, ability to retaliate 4. Segment saturation • Gaps in the market 5. Protectability • Patentability of products, barriers to entry 6. Environmental risk • Economic, political, and technological change III. Product-Market Fit 7. Fit • Coherence with company’s strengths and image 8. Relationships with • Synergy, cost interactions, image transfers, segments cannibalization 9. Profitability • Entry costs, margin levels, return on investment Which Segments to Serve?—Segment Attractiveness Criteria
Selecting Segments to Serve E Strong Firm’s Competitive Position B Medium D A C Weak Low Average High Segment Attractiveness
Discriminant Analysis forDescribing Market Segments • Identify a set of “observable” variables that helps you to understand how to reach and serve the needs of selected clusters. • Use discriminant analysis to identify underlying dimensions (axes) that maximally differentiate between the selected clusters.
Two-Group Discriminant Analysis XXOXOOO XXXOXXOOOO XXXXOOOXOOO XXOXXOXOOOO XXOXOOOOOOO Price Sensitivity X-segment Need for Data Storage O-segment x = high propensity to buy o = low propensity to buy
Interpreting Discriminant Analysis Results • What proportion of the total variance in the descriptor data is explained by the statistically significant discriminant axes? • Does the model have good predictability (“hit rate”) in each cluster? • Can you identify good descriptors to find differences between clusters? (Examine correlations between discriminant axes and each descriptor variable).
Behavior-Based Segmentation • Traditional segmentation (eg, demographic,psychographic) • Needs-based segmentation • Behavior-based segmentation (choice models)
Choice Models 1. Observe choice: (Buy/not buy => direct marketers Brand bought => packaged goods, ABB) 2. Capture related data: • demographics • attitudes/perceptions • market conditions (price, promotion, etc.) 3. Link 1 to 2 via “choice model” => model reveals importance weights of characteristics
Choice Models vs Surveys With standard survey methods . . . preference/ importance choice ï weights ´perceptionsñññ predict observe/ask observe/ask But with choice models . . . importance choice ï weights ´ perceptionsñññ observe infer observe/ask